NLRB Stats Archive › Annual Reports › FY1943 › Number of cases filed, 1936–43
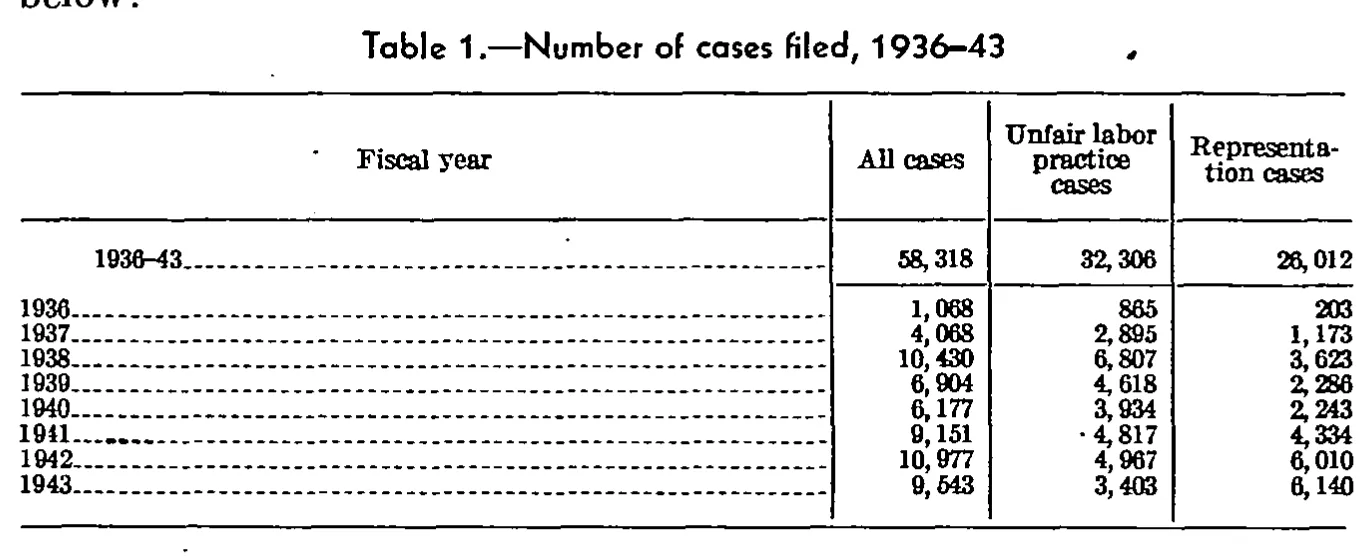
Number of cases filed, 1936–43
| Fiscal year | All cases | Unfair labor practice cases | Representation cases |
|---|---|---|---|
| 1936-43 | 58,318 | 32,306 | 26,012 |
| 1936 | 1,068 | 865 | 203 |
| 1937 | 4,068 | 2,895 | 1,173 |
| 1938 | 10,430 | 6,807 | 3,623 |
| 1939 | 6,904 | 4,618 | 2,286 |
| 1940 | 6,177 | 3,934 | 2,243 |
| 1941 | 9,151 | 4,817 | 4,334 |
| 1942 | 10,977 | 4,967 | 6,010 |
| 1943 | 9,543 | 3,403 | 6,140 |
27 of 27 figures sit in a row or column sum that works out.
Reader’s notes
p. 24. Four columns; one heading level. The stub label of the first body row is printed with an en dash ("1936-43"), matching the caption's year span; it is the grand-total row for the period. A stray ink speck sits immediately left of "4,817" (row 1941, "Unfair labor practice cases"); it is scan dirt from the broken leader-dot rule, not a footnote marker, so the cell is transcribed as 4,817. The scan is coarse and several digits are partly filled in: "26,012" (row 1936-43, Representation cases) could be misread as 28,012, "6,140" (row 1943, Representation cases) could be misread as 0,140, and "1936" in the stub could be misread as 1930 — in each case the reading given is confirmed by the arithmetic. All rows and columns are internally consistent as printed: each year's unfair labor practice plus representation cases equals its all-cases figure, and the eight year rows sum exactly to the 1936-43 totals (58,318 = 32,306 + 26,012). Above the caption the crop clips the last word ("below.") of the preceding body text; it is not part of the table.
Source image
Source data: U.S. NLRB Annual Reports (public domain). Reconstruction by NLRB Stats Archive. Read by claude-opus-5 (effort max, prompt extract_v1) from the 300-dpi scan; stitched by page. Updated October 2026.