NLRB Stats Archive › Annual Reports › FY1942 › Number of elections and pay-roll checks and number of valid votes cast during the fiscal year 1942, by industry
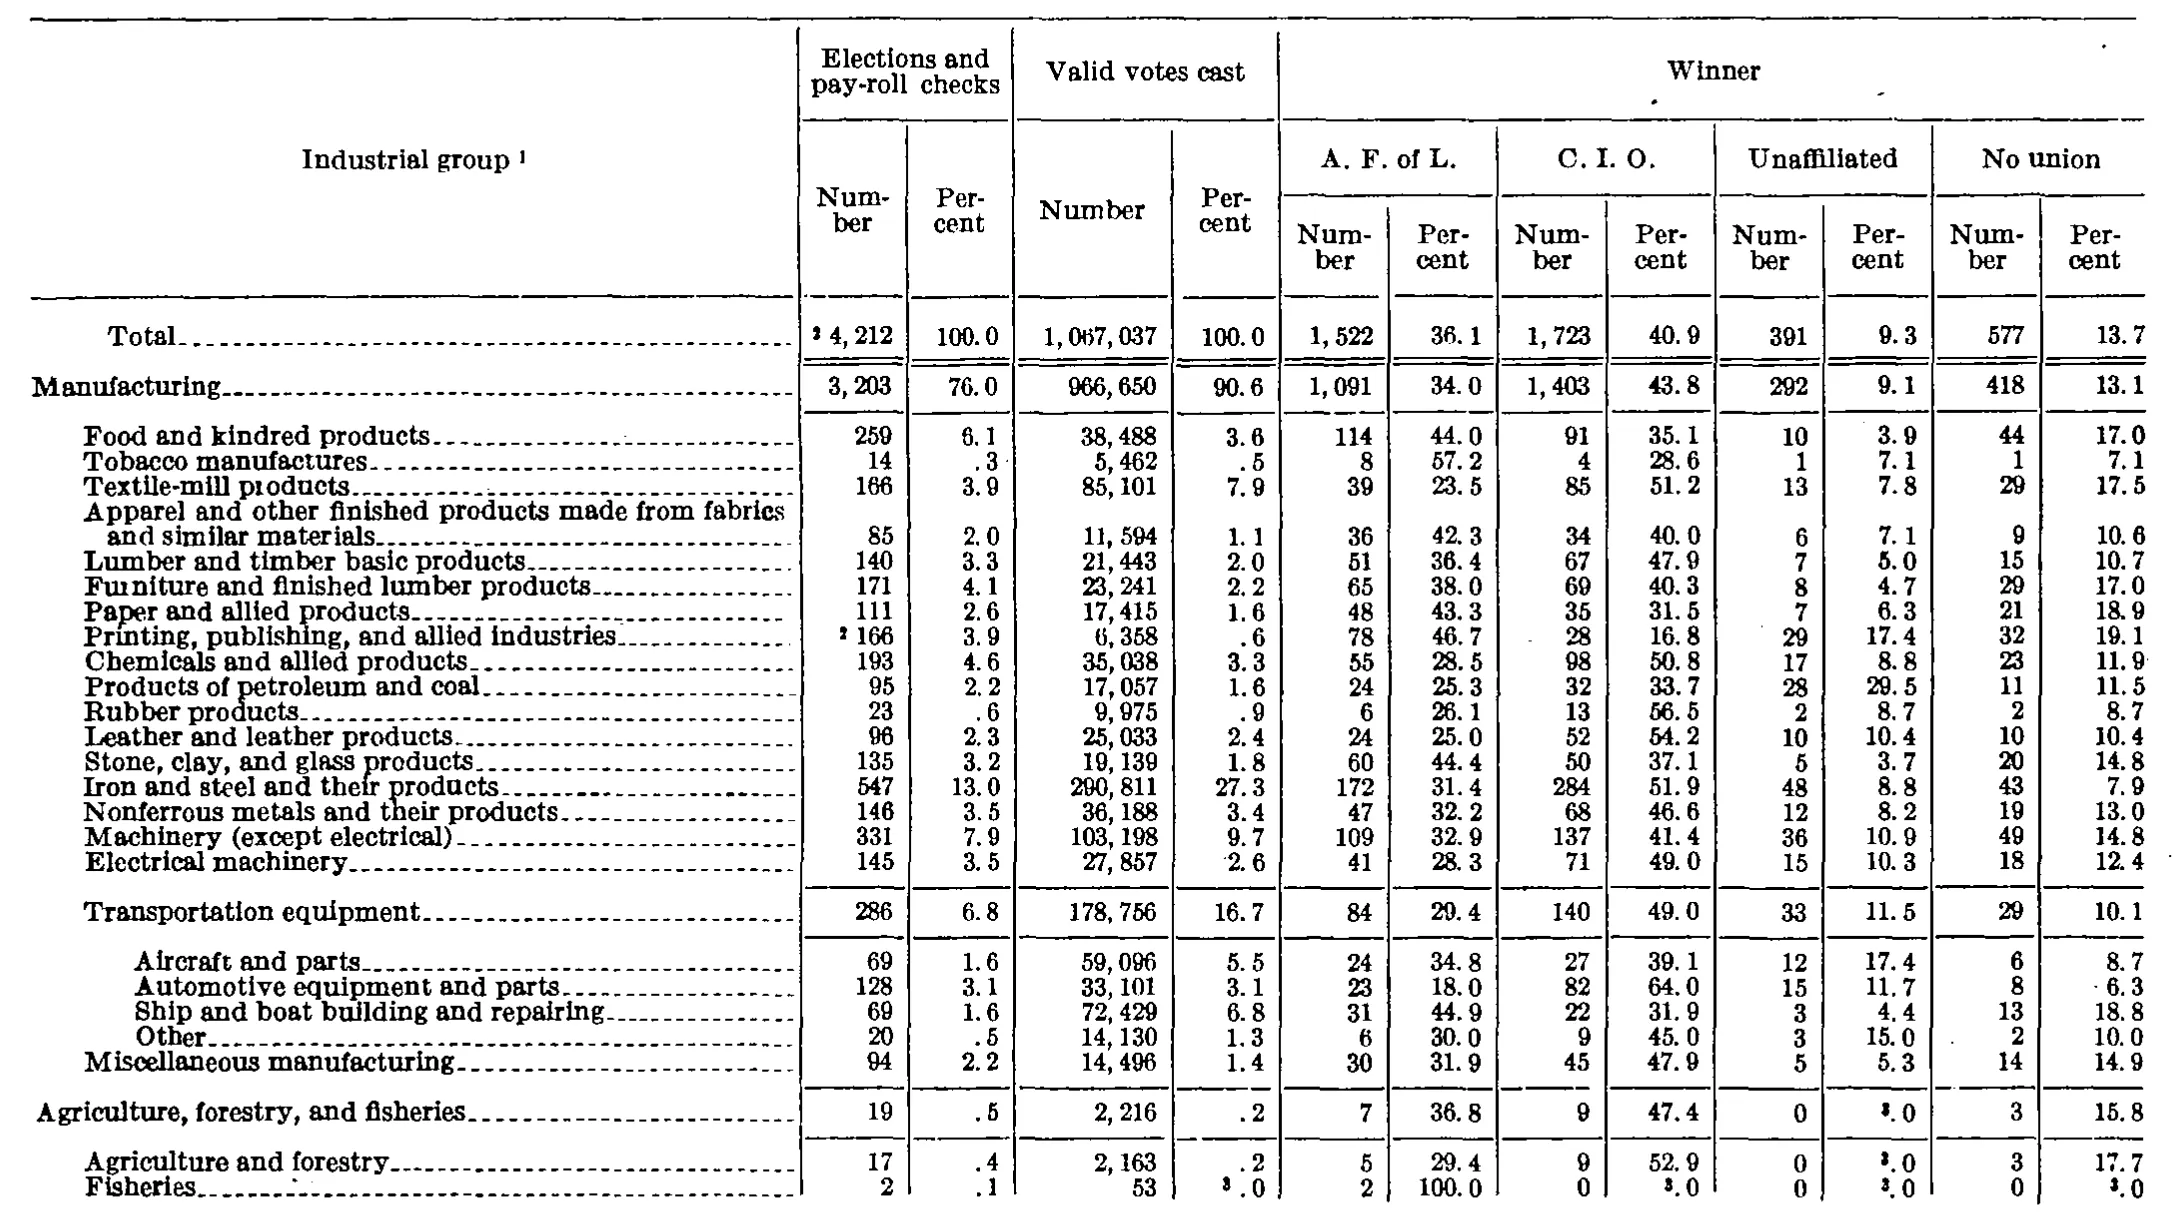
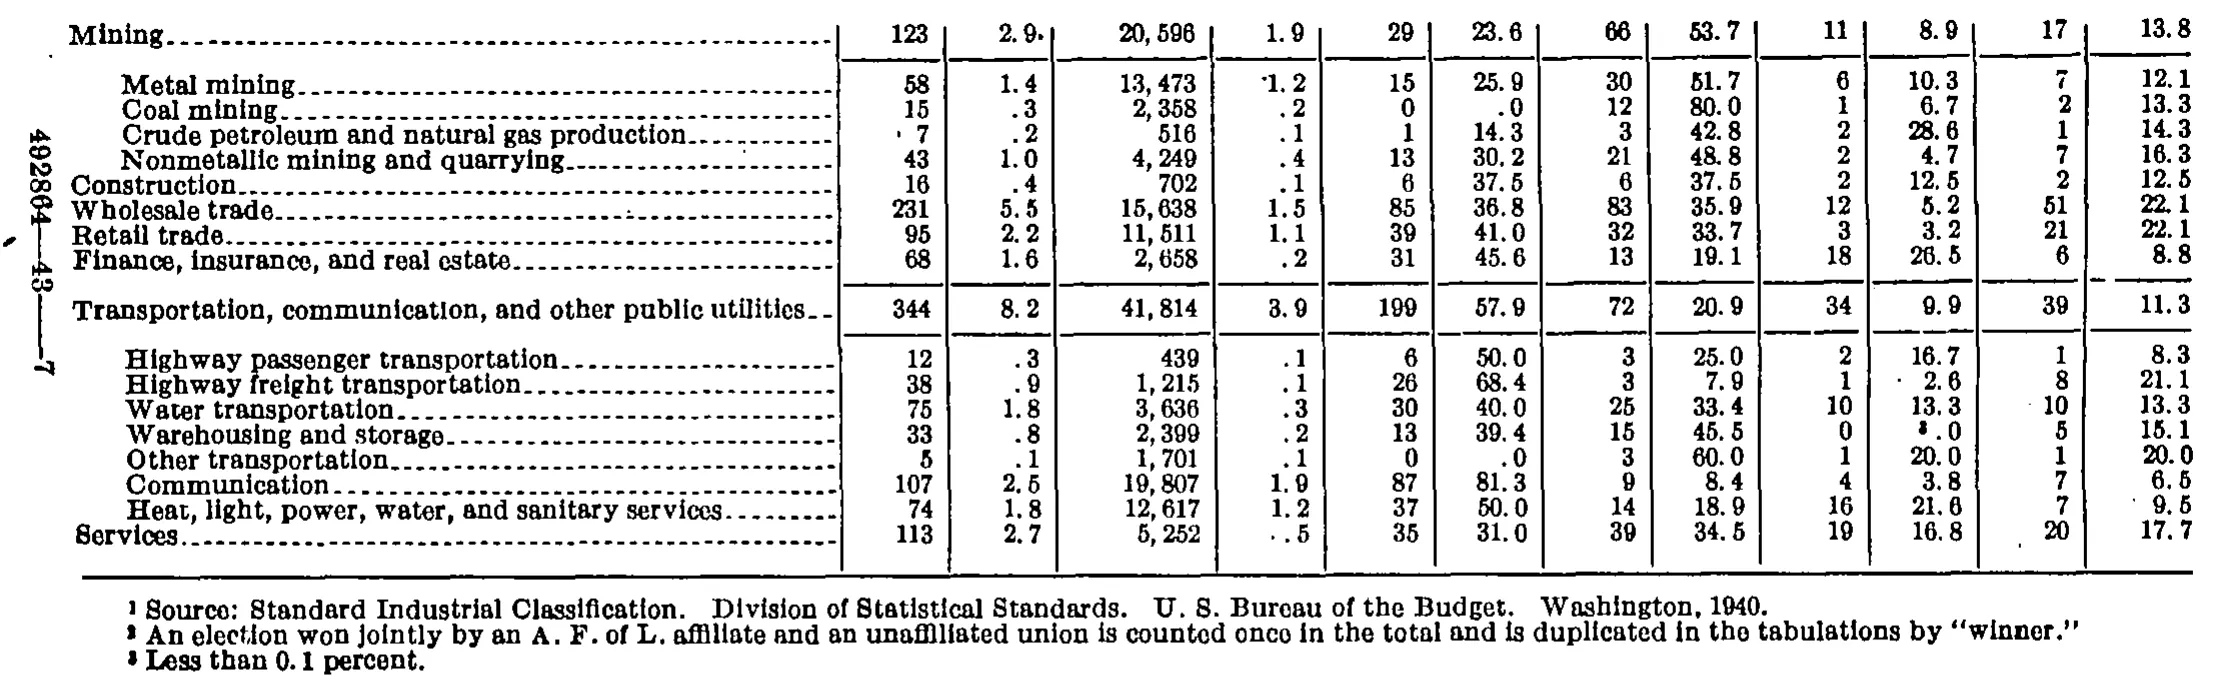
Number of elections and pay-roll checks and number of valid votes cast during the fiscal year 1942, by industry
Stitched from pp. 93–94.
| Industrial group | Elections and pay-roll checks | Valid votes cast | Winner | |||||||||
|---|---|---|---|---|---|---|---|---|---|---|---|---|
| Industrial group | Elections and pay-roll checks | Valid votes cast | A. F. of L. | C. I. O. | Unaffiliated | No union | ||||||
| Industrial group | Number | Percent | Number | Percent | Number | Percent | Number | Percent | Number | Percent | Number | Percent |
| Total | 4,212 | 100.0 | 1,067,037 | 100.0 | 1,522 | 36.1 | 1,723 | 40.9 | 391 | 9.3 | 577 | 13.7 |
| Manufacturing | 3,203 | 76.0 | 966,650 | 90.6 | 1,091 | 34.0 | 1,403 | 43.8 | 292 | 9.1 | 418 | 13.1 |
| Food and kindred products | 259 | 6.1 | 38,488 | 3.6 | 114 | 44.0 | 91 | 35.1 | 10 | 3.9 | 44 | 17.0 |
| Tobacco manufactures | 14 | .3 | 5,462 | .5 | 8 | 57.2 | 4 | 28.6 | 1 | 7.1 | 1 | 7.1 |
| Textile-mill products | 166 | 3.9 | 85,101 | 7.9 | 39 | 23.5 | 85 | 51.2 | 13 | 7.8 | 29 | 17.5 |
| Apparel and other finished products made from fabrics and similar materials | 85 | 2.0 | 11,594 | 1.1 | 36 | 42.3 | 34 | 40.0 | 6 | 7.1 | 9 | 10.6 |
| Lumber and timber basic products | 140 | 3.3 | 21,443 | 2.0 | 51 | 36.4 | 67 | 47.9 | 7 | 5.0 | 15 | 10.7 |
| Furniture and finished lumber products | 171 | 4.1 | 23,241 | 2.2 | 65 | 38.0 | 69 | 40.3 | 8 | 4.7 | 29 | 17.0 |
| Paper and allied products | 111 | 2.6 | 17,415 | 1.6 | 48 | 43.3 | 35 | 31.5 | 7 | 6.3 | 21 | 18.9 |
| Printing, publishing, and allied industries | 166 | 3.9 | 6,358 | .6 | 78 | 46.7 | 28 | 16.8 | 29 | 17.4 | 32 | 19.1 |
| Chemicals and allied products | 193 | 4.6 | 35,038 | 3.3 | 55 | 28.5 | 98 | 50.8 | 17 | 8.8 | 23 | 11.9 |
| Products of petroleum and coal | 95 | 2.2 | 17,057 | 1.6 | 24 | 25.3 | 32 | 33.7 | 28 | 29.5 | 11 | 11.5 |
| Rubber products | 23 | .6 | 9,975 | .9 | 6 | 26.1 | 13 | 56.5 | 2 | 8.7 | 2 | 8.7 |
| Leather and leather products | 96 | 2.3 | 25,033 | 2.4 | 24 | 25.0 | 52 | 54.2 | 10 | 10.4 | 10 | 10.4 |
| Stone, clay, and glass products | 135 | 3.2 | 19,139 | 1.8 | 60 | 44.4 | 50 | 37.1 | 5 | 3.7 | 20 | 14.8 |
| Iron and steel and their products | 547 | 13.0 | 290,811 | 27.3 | 172 | 31.4 | 284 | 51.9 | 48 | 8.8 | 43 | 7.9 |
| Nonferrous metals and their products | 146 | 3.5 | 36,188 | 3.4 | 47 | 32.2 | 68 | 46.6 | 12 | 8.2 | 19 | 13.0 |
| Machinery (except electrical) | 331 | 7.9 | 103,198 | 9.7 | 109 | 32.9 | 137 | 41.4 | 36 | 10.9 | 49 | 14.8 |
| Electrical machinery | 145 | 3.5 | 27,857 | 2.6 | 41 | 28.3 | 71 | 49.0 | 15 | 10.3 | 18 | 12.4 |
| Transportation equipment | 286 | 6.8 | 178,756 | 16.7 | 84 | 29.4 | 140 | 49.0 | 33 | 11.5 | 29 | 10.1 |
| Aircraft and parts | 69 | 1.6 | 59,096 | 5.5 | 24 | 34.8 | 27 | 39.1 | 12 | 17.4 | 6 | 8.7 |
| Automotive equipment and parts | 128 | 3.1 | 33,101 | 3.1 | 23 | 18.0 | 82 | 64.0 | 15 | 11.7 | 8 | 6.3 |
| Ship and boat building and repairing | 69 | 1.6 | 72,429 | 6.8 | 31 | 44.9 | 22 | 31.9 | 3 | 4.4 | 13 | 18.8 |
| Other | 20 | .5 | 14,130 | 1.3 | 6 | 30.0 | 9 | 45.0 | 3 | 15.0 | 2 | 10.0 |
| Miscellaneous manufacturing | 94 | 2.2 | 14,496 | 1.4 | 30 | 31.9 | 45 | 47.9 | 5 | 5.3 | 14 | 14.9 |
| Agriculture, forestry, and fisheries | 19 | .5 | 2,216 | .2 | 7 | 36.8 | 9 | 47.4 | 0 | .0 | 3 | 15.8 |
| Agriculture and forestry | 17 | .4 | 2,163 | .2 | 5 | 29.4 | 9 | 52.9 | 0 | .0 | 3 | 17.7 |
| Fisheries | 2 | .1 | 53 | .0 | 2 | 100.0 | 0 | .0 | 0 | .0 | 0 | .0 |
| Mining | 123 | 2.9 | 20,596 | 1.9 | 29 | 23.6 | 66 | 53.7 | 11 | 8.9 | 17 | 13.8 |
| Metal mining | 58 | 1.4 | 13,473 | 1.2 | 15 | 25.9 | 30 | 51.7 | 6 | 10.3 | 7 | 12.1 |
| Coal mining | 15 | .3 | 2,358 | .2 | 0 | .0 | 12 | 80.0 | 1 | 6.7 | 2 | 13.3 |
| Crude petroleum and natural gas production | 7 | .2 | 516 | .1 | 1 | 14.3 | 3 | 42.8 | 2 | 28.6 | 1 | 14.3 |
| Nonmetallic mining and quarrying | 43 | 1.0 | 4,249 | .4 | 13 | 30.2 | 21 | 48.8 | 2 | 4.7 | 7 | 16.3 |
| Construction | 16 | .4 | 702 | .1 | 6 | 37.5 | 6 | 37.5 | 2 | 12.5 | 2 | 12.5 |
| Wholesale trade | 231 | 5.5 | 15,638 | 1.5 | 85 | 36.8 | 83 | 35.9 | 12 | 5.2 | 51 | 22.1 |
| Retail trade | 95 | 2.2 | 11,511 | 1.1 | 39 | 41.0 | 32 | 33.7 | 3 | 3.2 | 21 | 22.1 |
| Finance, insurance, and real estate | 68 | 1.6 | 2,658 | .2 | 31 | 45.6 | 13 | 19.1 | 18 | 26.5 | 6 | 8.8 |
| Transportation, communication, and other public utilities | 344 | 8.2 | 41,814 | 3.9 | 199 | 57.9 | 72 | 20.9 | 34 | 9.9 | 39 | 11.3 |
| Highway passenger transportation | 12 | .3 | 439 | .1 | 6 | 50.0 | 3 | 25.0 | 2 | 16.7 | 1 | 8.3 |
| Highway freight transportation | 38 | .9 | 1,215 | .1 | 26 | 68.4 | 3 | 7.9 | 1 | 2.6 | 8 | 21.1 |
| Water transportation | 75 | 1.8 | 3,636 | .3 | 30 | 40.0 | 25 | 33.4 | 10 | 13.3 | 10 | 13.3 |
| Warehousing and storage | 33 | .8 | 2,399 | .2 | 13 | 39.4 | 15 | 45.5 | 0 | .0 | 5 | 15.1 |
| Other transportation | 5 | .1 | 1,701 | .1 | 0 | .0 | 3 | 60.0 | 1 | 20.0 | 1 | 20.0 |
| Communication | 107 | 2.5 | 19,807 | 1.9 | 87 | 81.3 | 9 | 8.4 | 4 | 3.8 | 7 | 6.5 |
| Heat, light, power, water, and sanitary services | 74 | 1.8 | 12,617 | 1.2 | 37 | 50.0 | 14 | 18.9 | 16 | 21.6 | 7 | 9.5 |
| Services | 113 | 2.7 | 5,252 | .5 | 35 | 31.0 | 39 | 34.5 | 19 | 16.8 | 20 | 17.7 |
- 1 Source: Standard Industrial Classification. Division of Statistical Standards. U. S. Bureau of the Budget. Washington, 1940.
- 2 An election won jointly by an A. F. of L. affiliate and an unaffiliated union is counted once in the total and is duplicated in the tabulations by "winner."
- 3 Less than 0.1 percent.
219 of 268 figures sit in a row or column sum that works out.
Reader’s notes
p. 93. The crop cuts the table off after the "Fisheries" row (that row's rule is only partly visible); the table continues below/on the next page, and no footnote text appears in the crop, so `footnotes` is empty even though markers 1, 2 and 3 are used. Marker reading: the stub heading carries a raised 1. A raised digit is printed before the Total row's "Elections and pay-roll checks, Number" value (4,212) and before the "Printing, publishing, and allied industries" value (166); at this scan resolution the Total one could be read as 2 or 3, but I transcribed both as ^2 because the arithmetic ties them together (see below). The raised digits before the ".0" percent cells (Agriculture, forestry, and fisheries / Agriculture and forestry, Unaffiliated Percent; Fisheries, Valid votes cast Percent, C. I. O. Percent, Unaffiliated Percent and No union Percent) read as 3. Arithmetic as printed: the four Winner "Number" columns sum to 4,213 for Total, 3,204 for Manufacturing and 167 for "Printing, publishing, and allied industries", i.e. one more than the printed election counts 4,212, 3,203 and 166 — presumably what the footnote-2 marker on the Total and Printing counts explains. Transcribed exactly as printed, not corrected. Every other row and every column subtotal I checked (counts, votes, and percents summing to 100.0 across the four Winner percent columns) is internally consistent. "Tobacco manufactures", A. F. of L. Percent reads 57.2 (8/14 = 57.1), which appears to be a deliberate rounding adjustment so the row's Winner percents total 100.0; transcribed as printed. Stray ink specks sit just left of "6.3" ("Automotive equipment and parts", No union Percent) and "2.6" ("Electrical machinery", Valid votes cast Percent); both are scan noise, not footnote markers, and the values are transcribed plain.
p. 94. The crop is the lower continuation of a table carried over from the preceding page: no column headings are printed on this image, so header_rows is empty. The grid has 13 columns (stub plus six number/percent pairs), read off the printed column rules. Column structure confirmed arithmetically: for every row, columns 5+7+9+11 sum exactly to column 1, and columns 6+8+10+12 sum to 100.0. That cross-check passes for all 18 rows, which is strong evidence each value sits under the right column. Doubtful glyphs (300-ppi bitonal scan, 6/8 and 3/4 confusions): - "Heat, light, power, water, and sanitary services", column 10: the glyph could read 21.8, but 16/74 = 21.62 and the row's percents then total 100.0 exactly, so transcribed as 21.6. - "Water transportation", column 8: read as 33.4 (25/75 = 33.33); 33.4 makes the row total exactly 100.0, which is how the printer appears to have balanced it. Low risk of it actually being 33.3. - "Metal mining", column 4 ("1.2"), "Crude petroleum and natural gas production", column 1 ("7"), "Services", column 4 (".5"), and "Warehousing and storage", column 10 (".0") each carry a small raised speck immediately before the value. I judged these to be dirt on the scan rather than footnote markers and omitted them: footnote 3 ("Less than 0.1 percent") cannot apply to the Warehousing .0, since that row has 0 of 33 elections and the row's percents already total 100.0 exactly. Similarly "Mining", column 2 shows a trailing dot after 2.9 that I read as a speck. Percentages are transcribed as printed and not recomputed; several are truncated rather than rounded in the original (e.g. "Crude petroleum", column 8 is printed 42.8 where 3/7 = 42.86). The vertical string "492864-43--7" running up the left margin is the printer's signature mark, not a table row, and is excluded. No row labels or values appear cut off by the crop.
Source image
Source data: U.S. NLRB Annual Reports (public domain). Reconstruction by NLRB Stats Archive. Read by claude-opus-5 (effort max, prompt extract_v1) from the 300-dpi scan; stitched by page. Updated October 2026.