NLRB Stats Archive › Annual Reports › FY1942 › Distribution of cases and workers involved in cases received during the fiscal year 1942, by month
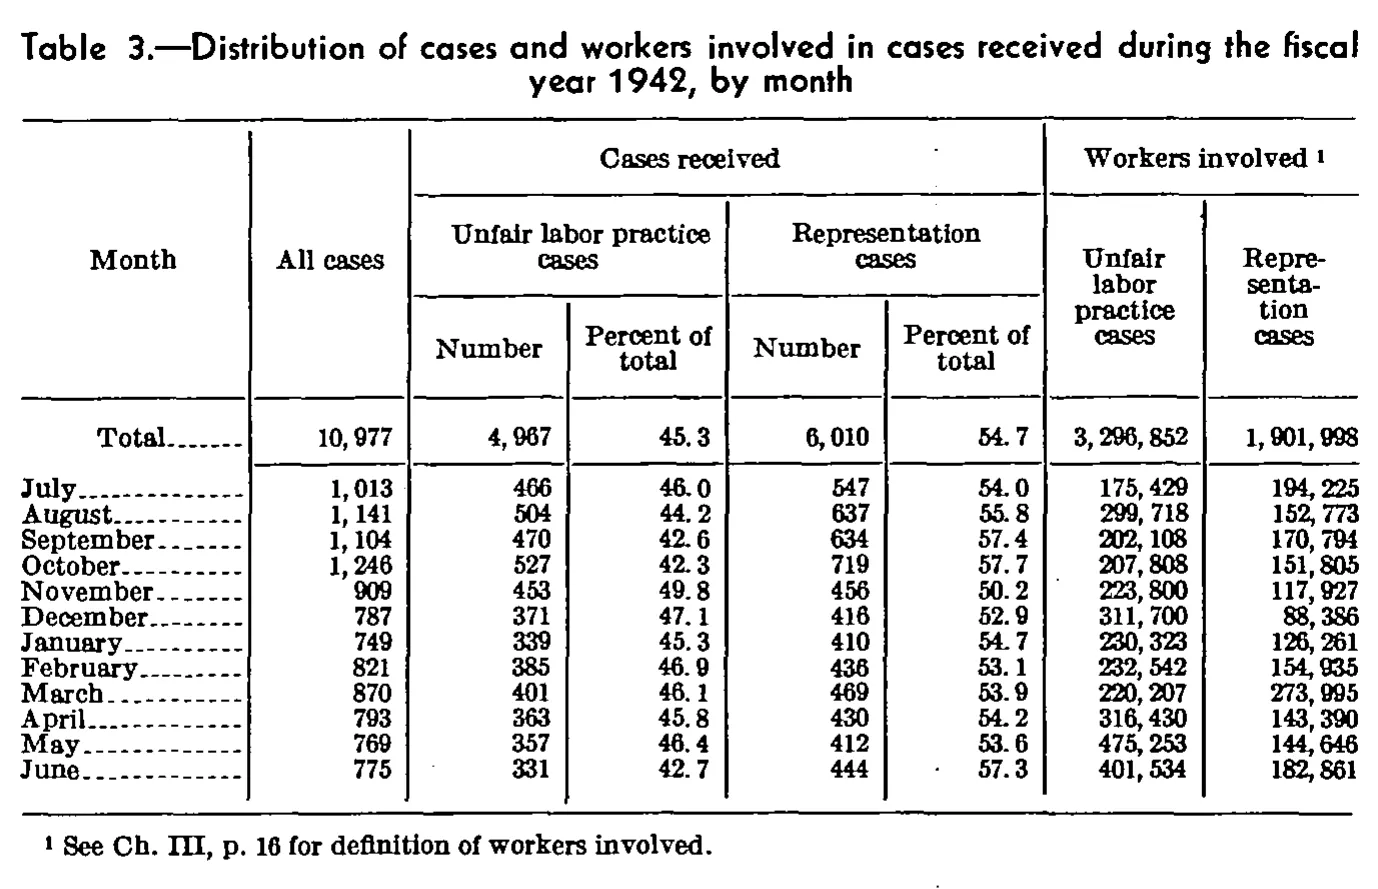
Distribution of cases and workers involved in cases received during the fiscal year 1942, by month
| Month | All cases | Cases received | Workers involved | ||||
|---|---|---|---|---|---|---|---|
| Month | All cases | Unfair labor practice cases | Representation cases | Unfair labor practice cases | Representation cases | ||
| Month | All cases | Number | Percent of total | Number | Percent of total | Unfair labor practice cases | Representation cases |
| Total | 10,977 | 4,967 | 45.3 | 6,010 | 54.7 | 3,296,852 | 1,901,998 |
| July | 1,013 | 466 | 46.0 | 547 | 54.0 | 175,429 | 194,225 |
| August | 1,141 | 504 | 44.2 | 637 | 55.8 | 299,718 | 152,773 |
| September | 1,104 | 470 | 42.6 | 634 | 57.4 | 202,108 | 170,794 |
| October | 1,246 | 527 | 42.3 | 719 | 57.7 | 207,808 | 151,805 |
| November | 909 | 453 | 49.8 | 456 | 50.2 | 223,800 | 117,927 |
| December | 787 | 371 | 47.1 | 416 | 52.9 | 311,700 | 88,386 |
| January | 749 | 339 | 45.3 | 410 | 54.7 | 230,323 | 126,261 |
| February | 821 | 385 | 46.9 | 436 | 53.1 | 232,542 | 154,935 |
| March | 870 | 401 | 46.1 | 469 | 53.9 | 220,207 | 273,995 |
| April | 793 | 363 | 45.8 | 430 | 54.2 | 316,430 | 143,390 |
| May | 769 | 357 | 46.4 | 412 | 53.6 | 475,253 | 144,646 |
| June | 775 | 331 | 42.7 | 444 | 57.3 | 401,534 | 182,861 |
- 1 See Ch. III, p. 16 for definition of workers involved.
65 of 65 figures sit in a row or column sum that works out.
Reader’s notes
p. 84. Eight printed columns: the stub (Month), "All cases", four columns under the spanner "Cases received" (Number and Percent of total for unfair labor practice cases, then for representation cases), and two columns under "Workers involved 1". The raised 1 on "Workers involved" is the footnote marker printed under the table. The "Total" row is printed first, above the monthly rows, and the months run July through June (fiscal year order); both are transcribed in printed order. All five count columns sum exactly to their printed totals (10,977; 4,967; 6,010; 3,296,852; 1,901,998), so no misprints are suspected. Typesetting leaves a space after each digit-grouping comma and after the decimal point in the percent columns (e.g. "10, 977", "45. 3"); these were closed up as instructed. Stray ink dots in the body (e.g. beside June's "775" and "444") are printing artifacts, not data. No cells were illegible.
Source image
Source data: U.S. NLRB Annual Reports (public domain). Reconstruction by NLRB Stats Archive. Read by claude-opus-5 (effort max, prompt extract_v1) from the 300-dpi scan; stitched by page. Updated October 2026.