NLRB Stats Archive › Annual Reports › FY1942 › Comparison of the distribution of workers and the distribution of valid votes cast in 12 leading manufacturing industries
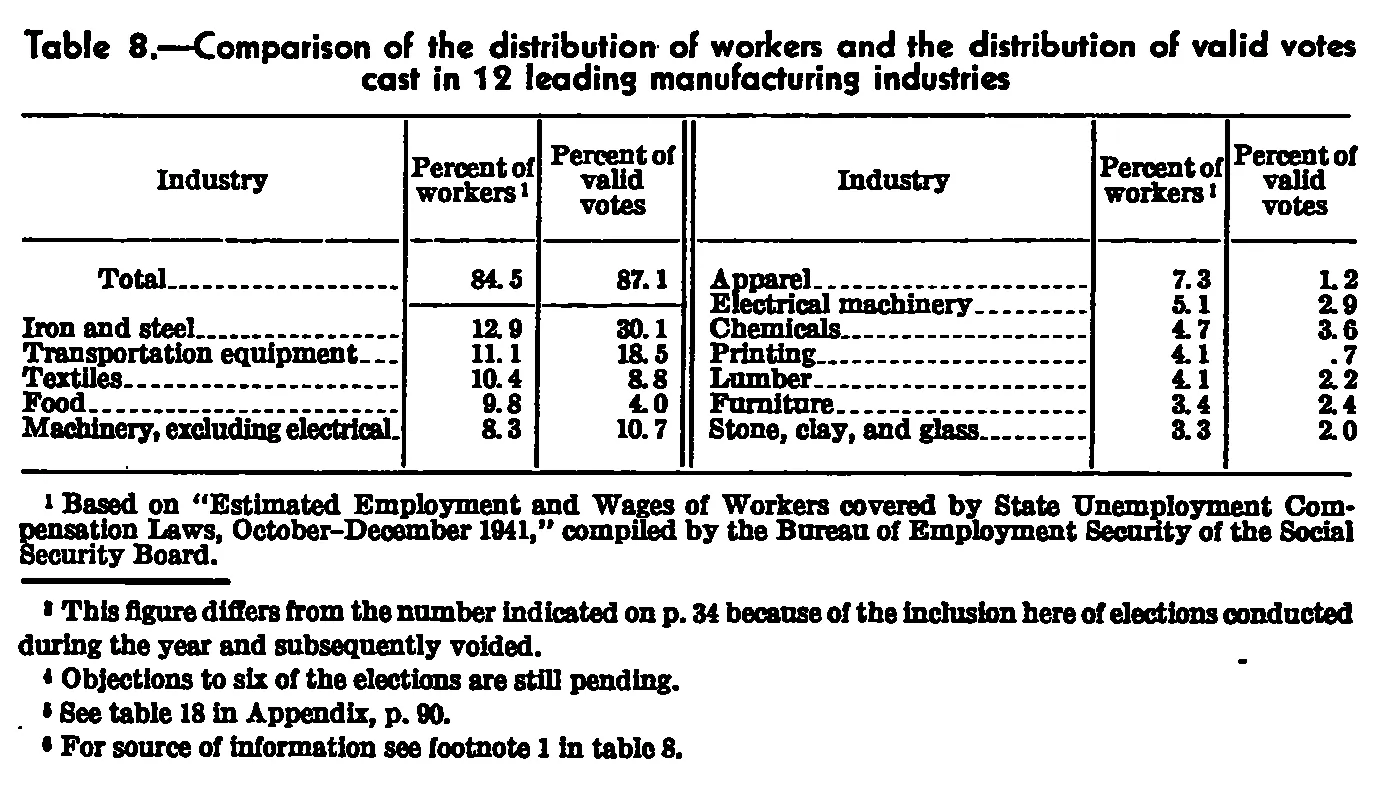
Comparison of the distribution of workers and the distribution of valid votes cast in 12 leading manufacturing industries
| Industry | Percent of workers | Percent of valid votes |
|---|---|---|
| Total | 84.5 | 87.1 |
| Iron and steel | 12.9 | 30.1 |
| Transportation equipment | 11.1 | 18.5 |
| Textiles | 10.4 | 8.8 |
| Food | 9.8 | 4.0 |
| Machinery, excluding electrical | 8.3 | 10.7 |
| Apparel | 7.3 | 1.2 |
| Electrical machinery | 5.1 | 2.9 |
| Chemicals | 4.7 | 3.6 |
| Printing | 4.1 | .7 |
| Lumber | 4.1 | 2.2 |
| Furniture | 3.4 | 2.4 |
| Stone, clay, and glass | 3.3 | 2.0 |
- 1 Based on "Estimated Employment and Wages of Workers covered by State Unemployment Compensation Laws, October-December 1941," compiled by the Bureau of Employment Security of the Social Security Board.
Reader’s notes
p. 43. Two-panel table (three columns repeated side by side); the left panel's rows (Total through "Machinery, excluding electrical") are given first, then the right panel's rows (Apparel through "Stone, clay, and glass"). The headings are printed once per panel and are given once here. The "Total" row is set off by a short rule below it in the left panel; the right panel has no total row, so its rows continue the same ranked list. "Printing" / "Percent of valid votes" is printed as ". 7" (no leading zero); transcribed as ".7". Below footnote 1 the crop shows a horizontal rule and four further footnotes that belong to a different table on the page (footnote 6 explicitly refers back to "footnote 1 in table 8"), so they are not listed in `footnotes`. They read: "3 This figure differs from the number indicated on p. 34 because of the inclusion here of elections conducted during the year and subsequently voided."; "4 Objections to six of the elections are still pending."; "5 See table 18 in Appendix, p. 90."; "6 For source of information see footnote 1 in table 8." The marker on the first of these is a raised digit that is blurred and reads as 3 (it could be misread as 8).
Source image
Source data: U.S. NLRB Annual Reports (public domain). Reconstruction by NLRB Stats Archive. Read by claude-opus-5 (effort max, prompt extract_v1) from the 300-dpi scan; stitched by page. Updated October 2026.