NLRB Stats Archive › Annual Reports › FY1942 › Industries with preponderance of unfair labor practice cases
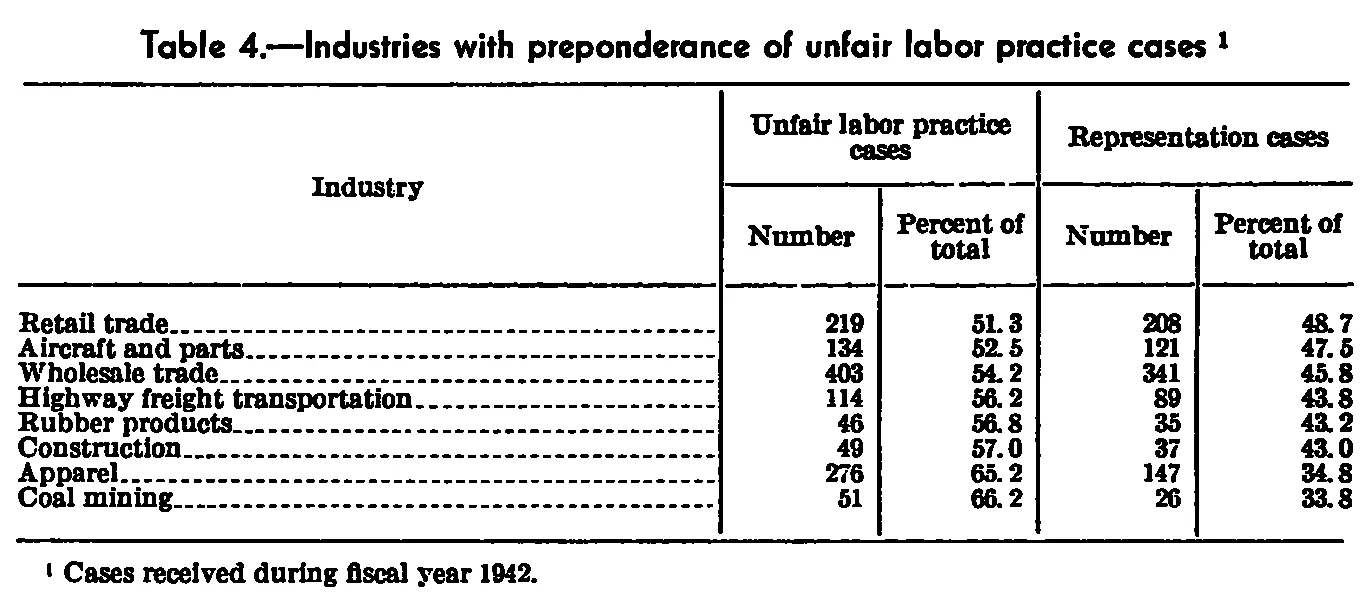
Industries with preponderance of unfair labor practice cases
| Industry | Unfair labor practice cases | Representation cases | ||
|---|---|---|---|---|
| Industry | Number | Percent of total | Number | Percent of total |
| Retail trade | 219 | 51.3 | 208 | 48.7 |
| Aircraft and parts | 134 | 52.5 | 121 | 47.5 |
| Wholesale trade | 403 | 54.2 | 341 | 45.8 |
| Highway freight transportation | 114 | 56.2 | 89 | 43.8 |
| Rubber products | 46 | 56.8 | 35 | 43.2 |
| Construction | 49 | 57.0 | 37 | 43.0 |
| Apparel | 276 | 65.2 | 147 | 34.8 |
| Coal mining | 51 | 66.2 | 26 | 33.8 |
- 1 Cases received during fiscal year 1942.
0 of 16 figures sit in a row or column sum that works out.
Reader’s notes
p. 27. Five printed columns: stub plus two spanner groups ("Unfair labor practice cases" and "Representation cases"), each over "Number" and "Percent of total". The percent figures are typeset with a space after the decimal point ("51. 3", "66. 2"); transcribed closed up as "51.3", "66.2". The footnote marker 1 is attached to the caption, which is omitted per instructions. No rows are cut off by the crop; the body consists of the eight industry rows with no total line. Percentages are internally consistent with the Number columns in every row (e.g., 219/(219+208)=51.3), so no suspected misprints.
Source image
Source data: U.S. NLRB Annual Reports (public domain). Reconstruction by NLRB Stats Archive. Read by claude-opus-5 (effort max, prompt extract_v1) from the 300-dpi scan; stitched by page. Updated October 2026.