NLRB Stats Archive › Annual Reports › FY1942 › Industries with preponderance of representation cases
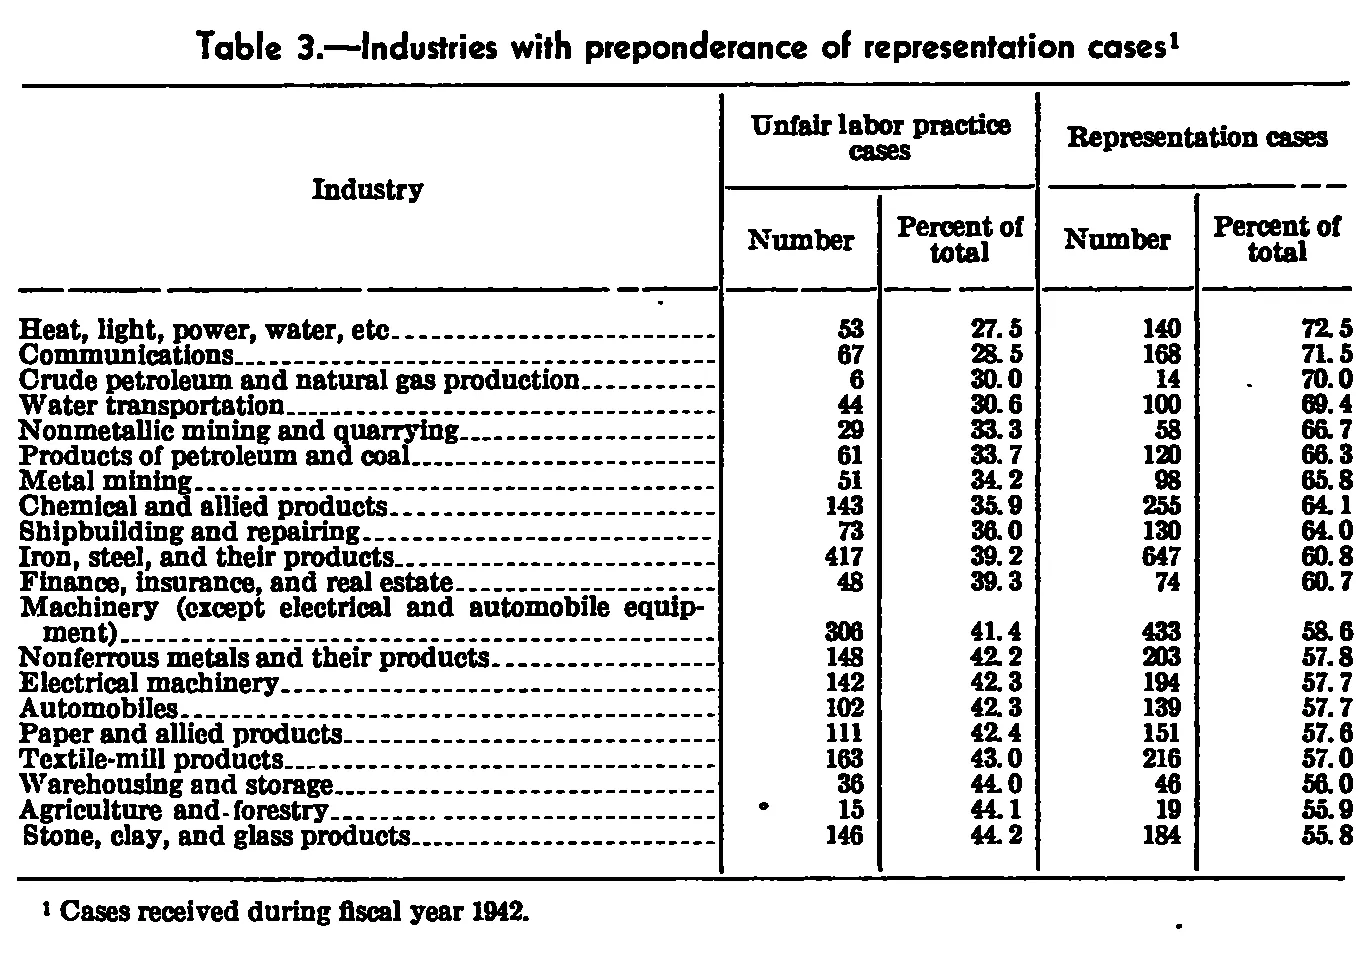
Industries with preponderance of representation cases
| Industry | Unfair labor practice cases | Representation cases | ||
|---|---|---|---|---|
| Industry | Number | Percent of total | Number | Percent of total |
| Heat, light, power, water, etc | 53 | 27.5 | 140 | 72.5 |
| Communications | 67 | 28.5 | 168 | 71.5 |
| Crude petroleum and natural gas production | 6 | 30.0 | 14 | 70.0 |
| Water transportation | 44 | 30.6 | 100 | 69.4 |
| Nonmetallic mining and quarrying | 29 | 33.3 | 58 | 66.7 |
| Products of petroleum and coal | 61 | 33.7 | 120 | 66.3 |
| Metal mining | 51 | 34.2 | 98 | 65.8 |
| Chemical and allied products | 143 | 35.9 | 255 | 64.1 |
| Shipbuilding and repairing | 73 | 36.0 | 130 | 64.0 |
| Iron, steel, and their products | 417 | 39.2 | 647 | 60.8 |
| Finance, insurance, and real estate | 48 | 39.3 | 74 | 60.7 |
| Machinery (except electrical and automobile equipment) | 306 | 41.4 | 433 | 58.6 |
| Nonferrous metals and their products | 148 | 42.2 | 203 | 57.8 |
| Electrical machinery | 142 | 42.3 | 194 | 57.7 |
| Automobiles | 102 | 42.3 | 139 | 57.7 |
| Paper and allied products | 111 | 42.4 | 151 | 57.6 |
| Textile-mill products | 163 | 43.0 | 216 | 57.0 |
| Warehousing and storage | 36 | 44.0 | 46 | 56.0 |
| Agriculture and forestry | 15 | 44.1 | 19 | 55.9 |
| Stone, clay, and glass products | 146 | 44.2 | 184 | 55.8 |
- 1 Cases received during fiscal year 1942.
0 of 40 figures sit in a row or column sum that works out.
Reader’s notes
p. 27. The table has no total row; it lists only the 20 industries in which representation cases predominated, ordered by ascending unfair-labor-practice percentage. All percent cells are typeset with a space after the decimal point (e.g. \"27. 5\"); these are written here without the space. The label \"Agriculture and forestry\" is printed with a stray ink mark between the words that resembles a hyphen (\"Agriculture and-forestry\"); it is transcribed as a space. Stray ink specks also appear in the body (left of the \"15\" on the Agriculture row, right of the \"14\" in the Crude petroleum row, and above the stub rule); they are not footnote markers. The caption carries footnote marker 1, which is excluded per instructions. Every row's two Number cells and two percentages are internally consistent, so no misprints are suspected.
Source image
Source data: U.S. NLRB Annual Reports (public domain). Reconstruction by NLRB Stats Archive. Read by claude-opus-5 (effort max, prompt extract_v1) from the 300-dpi scan; stitched by page. Updated October 2026.