NLRB Stats Archive › Annual Reports › FY1942 › Comparison of the distribution of Board cases and the distribution of workers covered by unemployment compensation in the 12 leading States
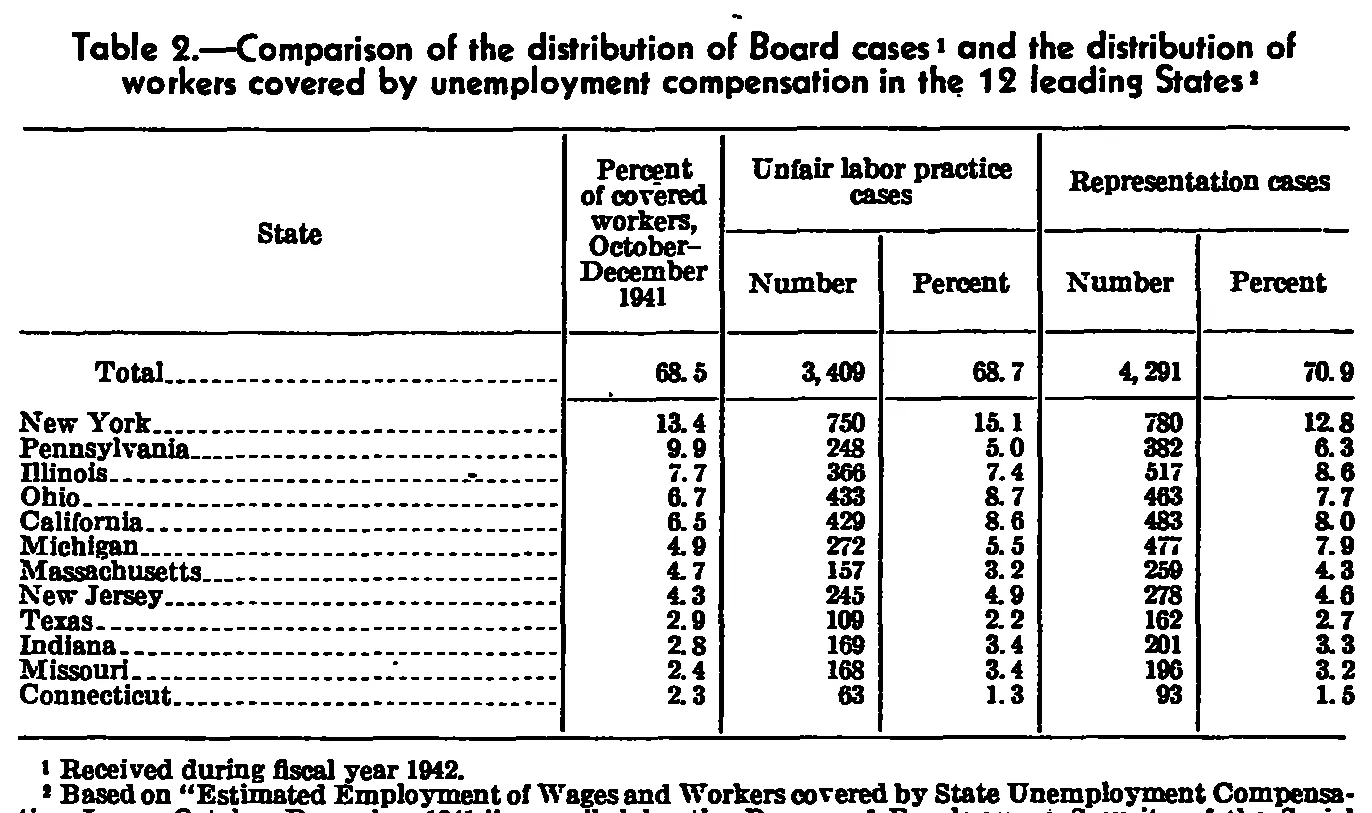
Comparison of the distribution of Board cases and the distribution of workers covered by unemployment compensation in the 12 leading States
| State | Percent of covered workers, October-December 1941 | Unfair labor practice cases | Representation cases | ||
|---|---|---|---|---|---|
| State | Percent of covered workers, October-December 1941 | Number | Percent | Number | Percent |
| Total | 68.5 | 3,409 | 68.7 | 4,291 | 70.9 |
| New York | 13.4 | 750 | 15.1 | 780 | 12.8 |
| Pennsylvania | 9.9 | 248 | 5.0 | 382 | 6.3 |
| Illinois | 7.7 | 366 | 7.4 | 517 | 8.6 |
| Ohio | 6.7 | 433 | 8.7 | 463 | 7.7 |
| California | 6.5 | 429 | 8.6 | 483 | 8.0 |
| Michigan | 4.9 | 272 | 5.5 | 477 | 7.9 |
| Massachusetts | 4.7 | 157 | 3.2 | 259 | 4.3 |
| New Jersey | 4.3 | 245 | 4.9 | 278 | 4.6 |
| Texas | 2.9 | 109 | 2.2 | 162 | 2.7 |
| Indiana | 2.8 | 169 | 3.4 | 201 | 3.3 |
| Missouri | 2.4 | 168 | 3.4 | 196 | 3.2 |
| Connecticut | 2.3 | 63 | 1.3 | 93 | 1.5 |
- 1 Received during fiscal year 1942.
- 2 Based on "Estimated Employment of Wages and Workers covered by State Unemployment Compensation Laws, October-December 1941," compiled by the Bureau of Employment Security of the Social
0 of 26 figures sit in a row or column sum that works out.
Reader’s notes
p. 25. Six columns: stub plus one covered-workers column and a Number/Percent pair under each of "Unfair labor practice cases" and "Representation cases". Doubtful cell: Massachusetts, "Representation cases / Number". The last digit is degraded in the scan and reads at first glance as 0 ("250"), but it is almost certainly a 9: the 12 state figures in that column sum to exactly 4,291 (the printed total) only with 259, and 259 is also what the printed 4.3 percent implies (250 would give 4.1). Transcribed as 259. Footnote 2 is cut off by the bottom edge of the crop: the last visible line ends with "... of the Social" and the remainder (presumably "Security Board" plus any closing text) is not on this image. Its wording "Estimated Employment of Wages and Workers covered by..." is transcribed as printed/legible; the scan is faint there and the original source title may read "Estimated Employment and Wages of Workers covered by...". No arithmetic was altered otherwise. Minor internal rounding quirks exist in the printed percentages (e.g. New York 780 shown as 12.8 and Illinois 517 as 8.6 do not come from a single consistent base), but all four value columns reproduce their printed totals exactly, so these are left as printed. The caption's footnote markers (1 after "Board cases", 2 after "12 leading States") belong to the caption, which is excluded per instructions. No footnote markers appear inside the grid.
Source image
Source data: U.S. NLRB Annual Reports (public domain). Reconstruction by NLRB Stats Archive. Read by claude-opus-5 (effort max, prompt extract_v1) from the 300-dpi scan; stitched by page. Updated October 2026.