NLRB Stats Archive › Annual Reports › FY1942 › Number of cases filed, 1936–1942
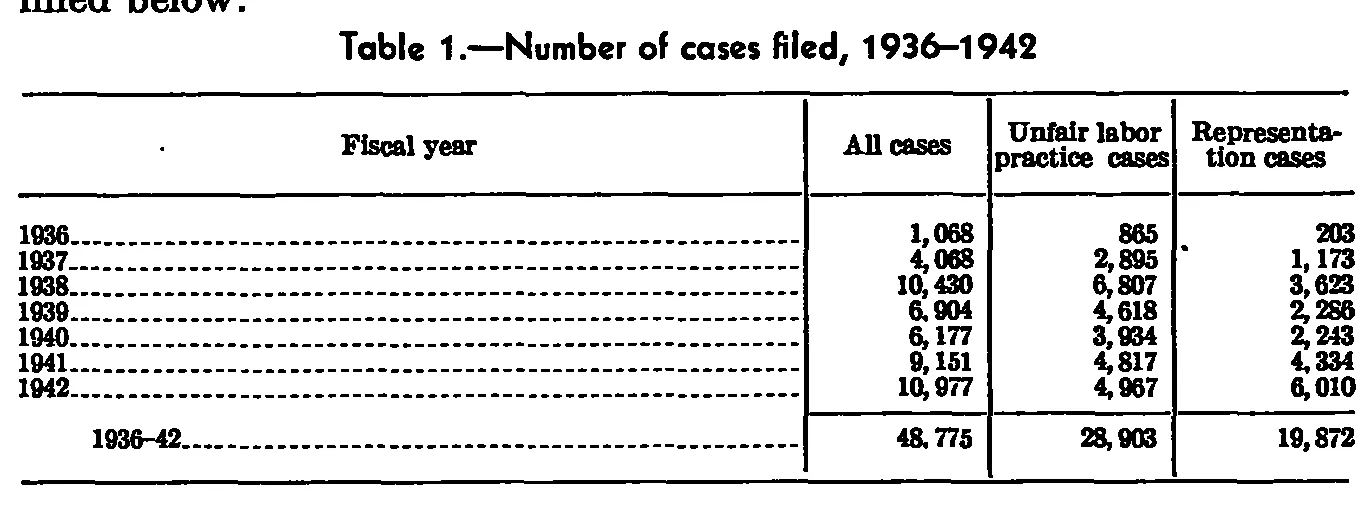
Number of cases filed, 1936–1942
| Fiscal year | All cases | Unfair labor practice cases | Representation cases |
|---|---|---|---|
| 1936 | 1,068 | 865 | 203 |
| 1937 | 4,068 | 2,895 | 1,173 |
| 1938 | 10,430 | 6,807 | 3,623 |
| 1939 | 6,904 | 4,618 | 2,286 |
| 1940 | 6,177 | 3,934 | 2,243 |
| 1941 | 9,151 | 4,817 | 4,334 |
| 1942 | 10,977 | 4,967 | 6,010 |
| 1936-42 | 48,775 | 28,903 | 19,872 |
24 of 24 figures sit in a row or column sum that works out.
Reader’s notes
p. 24. Four columns, one heading level. The last row ("1936-42", indented and set off by a rule) is the period total. A few digits are thickened by the scan: the 1936 "Representation cases" value reads 203, the 1939 value reads 2,286, and the 1938 value reads 3,623; all three are confirmed by the row and column arithmetic, which balances exactly in every row and in all three column totals. The stub label of the total row is printed with a short dash (1936-42) while the caption uses 1936-1942. Row labels are followed by leader dots, which have been dropped.
Source image
Source data: U.S. NLRB Annual Reports (public domain). Reconstruction by NLRB Stats Archive. Read by claude-opus-5 (effort max, prompt extract_v1) from the 300-dpi scan; stitched by page. Updated October 2026.