NLRB Stats Archive › Annual Reports › FY1941 › Number of cases and number of workers involved in cases closed by the National Labor Relations Board 1935-41, by nature of closing
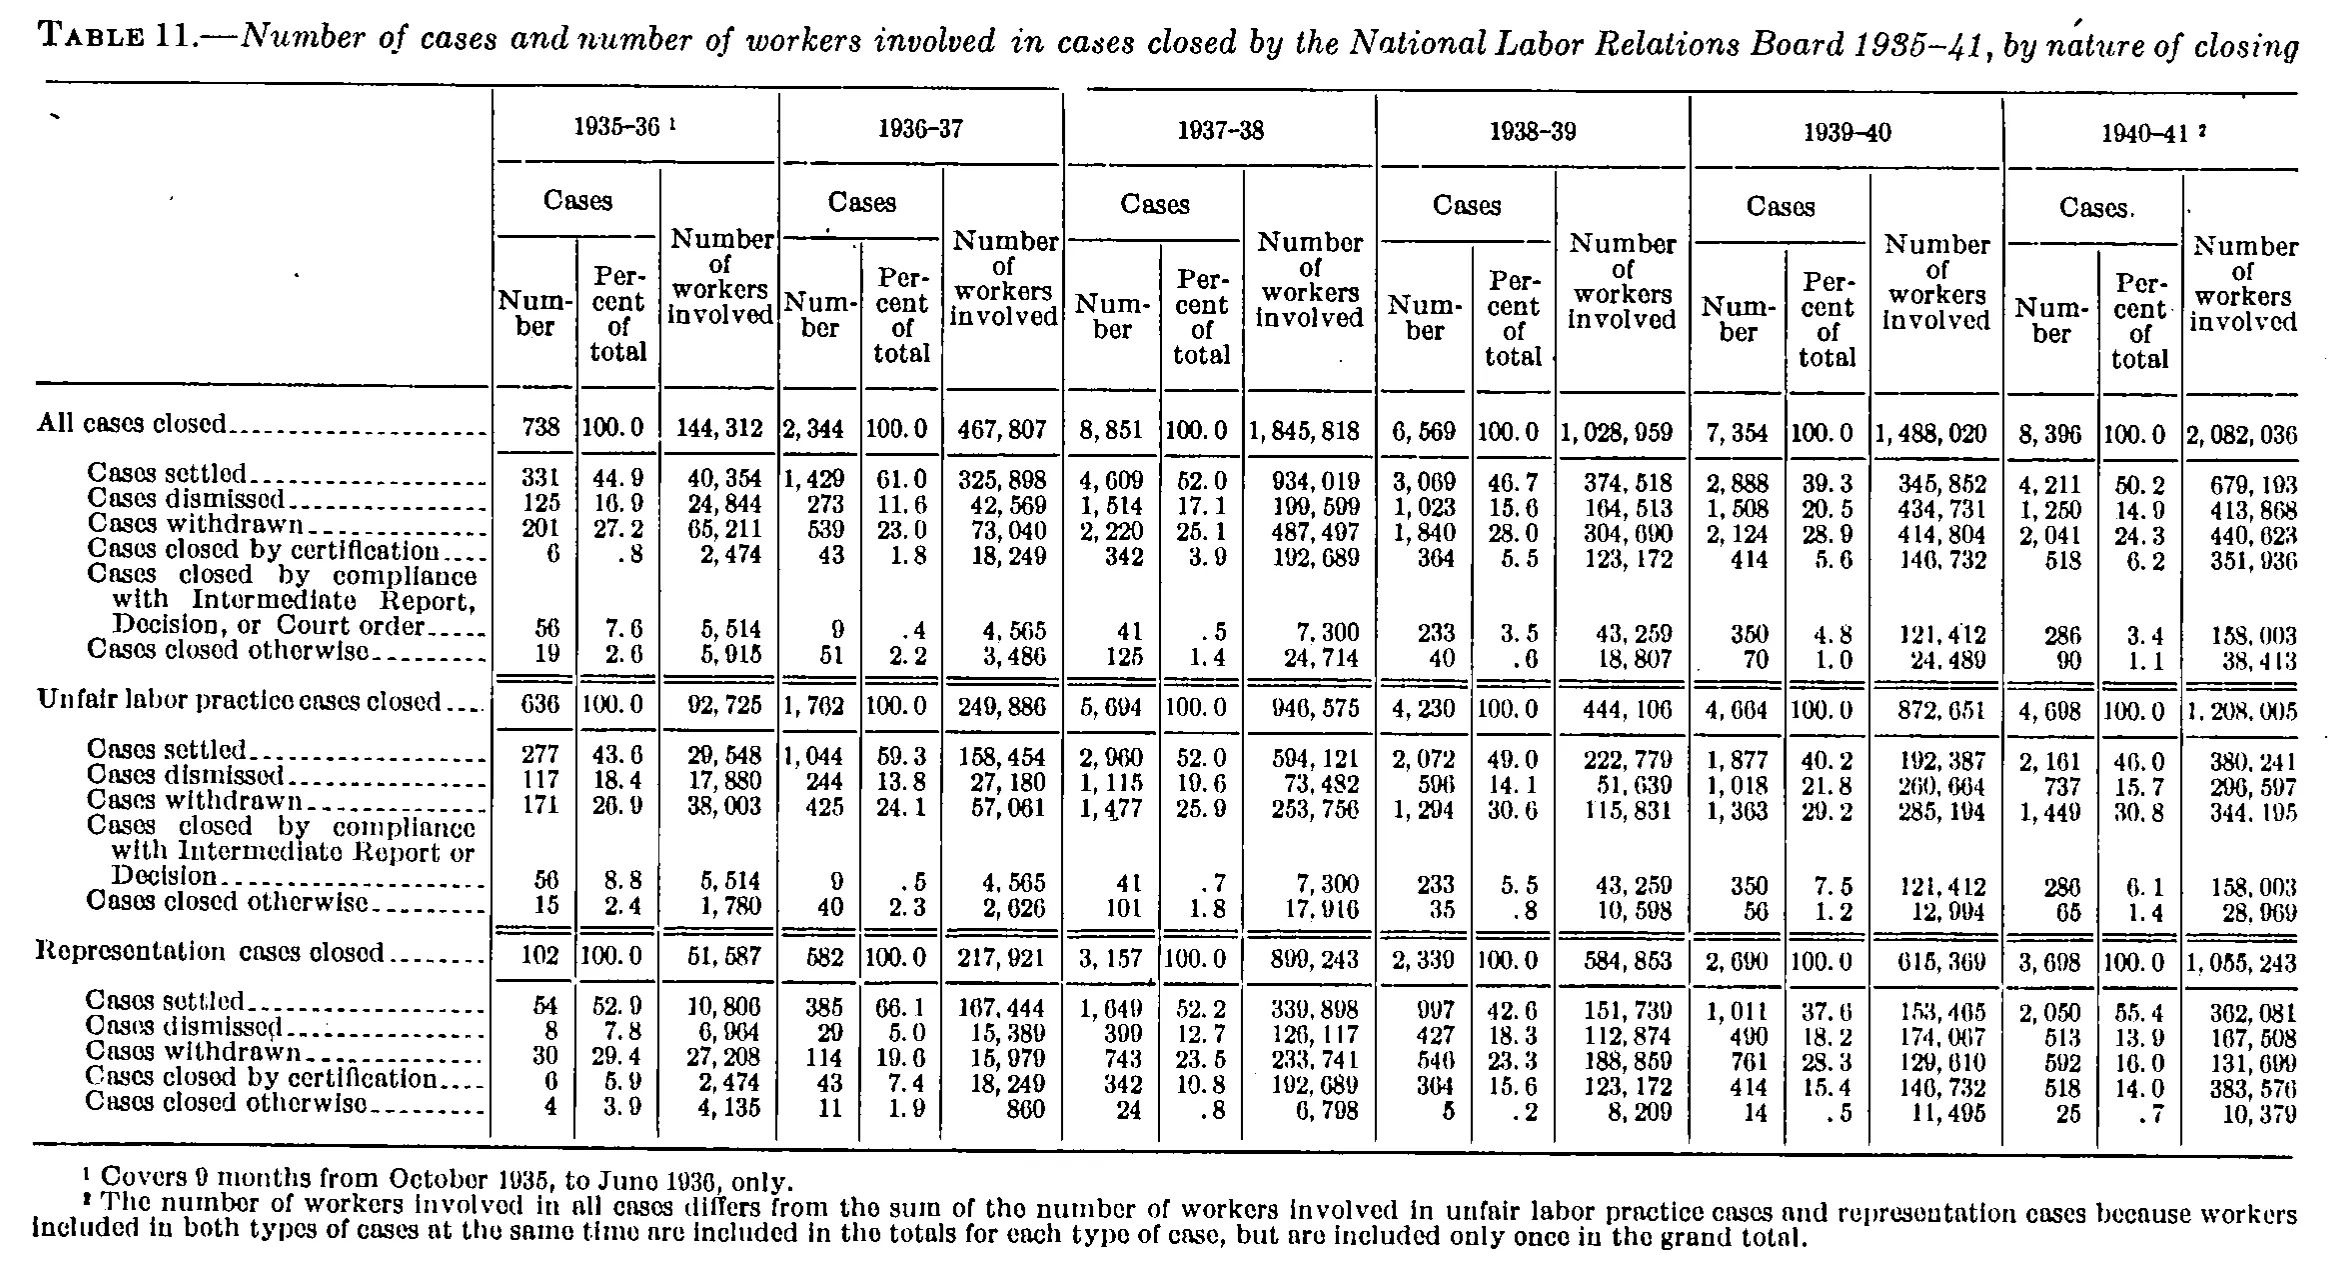
Number of cases and number of workers involved in cases closed by the National Labor Relations Board 1935-41, by nature of closing
| 1935-36 | 1936-37 | 1937-38 | 1938-39 | 1939-40 | 1940-41 | |||||||||||||
|---|---|---|---|---|---|---|---|---|---|---|---|---|---|---|---|---|---|---|
| Cases | Number of workers involved | Cases | Number of workers involved | Cases | Number of workers involved | Cases | Number of workers involved | Cases | Number of workers involved | Cases | Number of workers involved | |||||||
| Number | Percent of total | Number of workers involved | Number | Percent of total | Number of workers involved | Number | Percent of total | Number of workers involved | Number | Percent of total | Number of workers involved | Number | Percent of total | Number of workers involved | Number | Percent of total | Number of workers involved | |
| All cases closed | 738 | 100.0 | 144,312 | 2,344 | 100.0 | 467,807 | 8,851 | 100.0 | 1,845,818 | 6,569 | 100.0 | 1,028,959 | 7,354 | 100.0 | 1,488,020 | 8,396 | 100.0 | 2,082,036 |
| Cases settled | 331 | 44.9 | 40,354 | 1,429 | 61.0 | 325,898 | 4,609 | 52.0 | 934,019 | 3,069 | 46.7 | 374,518 | 2,888 | 39.3 | 345,852 | 4,211 | 50.2 | 679,193 |
| Cases dismissed | 125 | 16.9 | 24,844 | 273 | 11.6 | 42,569 | 1,514 | 17.1 | 199,599 | 1,023 | 15.6 | 164,513 | 1,508 | 20.5 | 434,731 | 1,250 | 14.9 | 413,868 |
| Cases withdrawn | 201 | 27.2 | 65,211 | 539 | 23.0 | 73,040 | 2,220 | 25.1 | 487,497 | 1,840 | 28.0 | 304,690 | 2,124 | 28.9 | 414,804 | 2,041 | 24.3 | 440,623 |
| Cases closed by certification | 6 | .8 | 2,474 | 43 | 1.8 | 18,249 | 342 | 3.9 | 192,689 | 364 | 5.5 | 123,172 | 414 | 5.6 | 146,732 | 518 | 6.2 | 351,936 |
| Cases closed by compliance with Intermediate Report, Decision, or Court order | 56 | 7.6 | 5,514 | 9 | .4 | 4,565 | 41 | .5 | 7,300 | 233 | 3.5 | 43,259 | 350 | 4.8 | 121,412 | 286 | 3.4 | 158,003 |
| Cases closed otherwise | 19 | 2.6 | 5,915 | 51 | 2.2 | 3,486 | 125 | 1.4 | 24,714 | 40 | .6 | 18,807 | 70 | 1.0 | 24,489 | 90 | 1.1 | 38,413 |
| Unfair labor practice cases closed | 636 | 100.0 | 92,725 | 1,762 | 100.0 | 249,886 | 5,694 | 100.0 | 946,575 | 4,230 | 100.0 | 444,106 | 4,664 | 100.0 | 872,651 | 4,698 | 100.0 | 1,208,005 |
| Cases settled | 277 | 43.6 | 29,548 | 1,044 | 59.3 | 158,454 | 2,960 | 52.0 | 594,121 | 2,072 | 49.0 | 222,779 | 1,877 | 40.2 | 192,387 | 2,161 | 46.0 | 380,241 |
| Cases dismissed | 117 | 18.4 | 17,880 | 244 | 13.8 | 27,180 | 1,115 | 19.6 | 73,482 | 596 | 14.1 | 51,639 | 1,018 | 21.8 | 260,664 | 737 | 15.7 | 296,597 |
| Cases withdrawn | 171 | 26.9 | 38,003 | 425 | 24.1 | 57,061 | 1,477 | 25.9 | 253,756 | 1,294 | 30.6 | 115,831 | 1,363 | 29.2 | 285,194 | 1,449 | 30.8 | 344,195 |
| Cases closed by compliance with Intermediate Report or Decision | 56 | 8.8 | 5,514 | 9 | .5 | 4,565 | 41 | .7 | 7,300 | 233 | 5.5 | 43,259 | 350 | 7.5 | 121,412 | 286 | 6.1 | 158,003 |
| Cases closed otherwise | 15 | 2.4 | 1,780 | 40 | 2.3 | 2,626 | 101 | 1.8 | 17,916 | 35 | .8 | 10,598 | 56 | 1.2 | 12,994 | 65 | 1.4 | 28,969 |
| Representation cases closed | 102 | 100.0 | 51,587 | 582 | 100.0 | 217,921 | 3,157 | 100.0 | 899,243 | 2,339 | 100.0 | 584,853 | 2,690 | 100.0 | 615,369 | 3,698 | 100.0 | 1,055,243 |
| Cases settled | 54 | 52.9 | 10,806 | 385 | 66.1 | 167,444 | 1,649 | 52.2 | 339,898 | 997 | 42.6 | 151,739 | 1,011 | 37.6 | 153,465 | 2,050 | 55.4 | 362,081 |
| Cases dismissed | 8 | 7.8 | 6,964 | 29 | 5.0 | 15,389 | 399 | 12.7 | 126,117 | 427 | 18.3 | 112,874 | 490 | 18.2 | 174,067 | 513 | 13.9 | 167,508 |
| Cases withdrawn | 30 | 29.4 | 27,208 | 114 | 19.6 | 15,979 | 743 | 23.5 | 233,741 | 546 | 23.3 | 188,859 | 761 | 28.3 | 129,610 | 592 | 16.0 | 131,699 |
| Cases closed by certification | 6 | 5.9 | 2,474 | 43 | 7.4 | 18,249 | 342 | 10.8 | 192,689 | 364 | 15.6 | 123,172 | 414 | 15.4 | 146,732 | 518 | 14.0 | 383,576 |
| Cases closed otherwise | 4 | 3.9 | 4,135 | 11 | 1.9 | 860 | 24 | .8 | 6,798 | 5 | .2 | 8,209 | 14 | .5 | 11,495 | 25 | .7 | 10,379 |
- 1 Covers 9 months from October 1935, to June 1936, only.
- 2 The number of workers involved in all cases differs from the sum of the number of workers involved in unfair labor practice cases and representation cases because workers included in both types of cases at the same time are included in the totals for each type of case, but are included only once in the grand total.
228 of 228 figures sit in a row or column sum that works out.
Reader’s notes
p. 36. 19 columns: a stub with no printed heading, then six fiscal-year groups of three columns each (Number / Percent of total / Number of workers involved). The stub heading cell is blank in the original. Three cells are printed on badly worn type where a 9 and a 0 are hard to tell apart; each was resolved by the table's own row/column arithmetic, and each resolved value makes every total in its panel balance exactly. A reviewer should re-check these three against a higher-resolution scan: (a) "Representation cases closed", 1938-39 Number = 2,339 (the glyph could be read 2,330; 2,339 is required by 6,569 - 4,230 and by all five percentages in that panel); (b) "Cases dismissed" in the unfair labor practice section, 1940-41 Number of workers involved = 296,597 (could be read 206,597; 296,597 is required for the column to sum to the printed 1,208,005, and 206,597 would make the all-cases dismissed figure exceed the sum of its two components, which is impossible); (c) "Cases settled" in the representation section, 1937-38 Number of workers involved = 339,898 (could be read 330,898; 339,898 is required for the column to sum to the printed 899,243 and for 594,121 + x = 934,019). Apparent inconsistency in the source, transcribed as printed: for 1940-41, "Cases closed by certification" shows 351,936 workers in the all-cases section but 383,576 workers in the representation section, although both sections report the same 518 cases. For every earlier year the two figures are identical. Both columns nonetheless sum exactly to their printed section totals, so neither value appears to be a misreading. The 1940-41 group heading is printed "Cases." with a trailing dot over the Number / Percent columns; transcribed as "Cases" since the dot is almost certainly a typographic artifact. Percentages under 1 percent are printed without a leading zero (".8", ".4") and are kept that way. Column rules, leader dots and the double rules that separate the three sections carry no data and are omitted.
Source image
Source data: U.S. NLRB Annual Reports (public domain). Reconstruction by NLRB Stats Archive. Read by claude-opus-5 (effort max, prompt extract_v1) from the 300-dpi scan; stitched by page. Updated October 2026.