NLRB Stats Archive › Annual Reports › FY1941 › Number of cases and number of workers involved in cases closed by the National Labor Relations Board 1935-41, by stage of closing
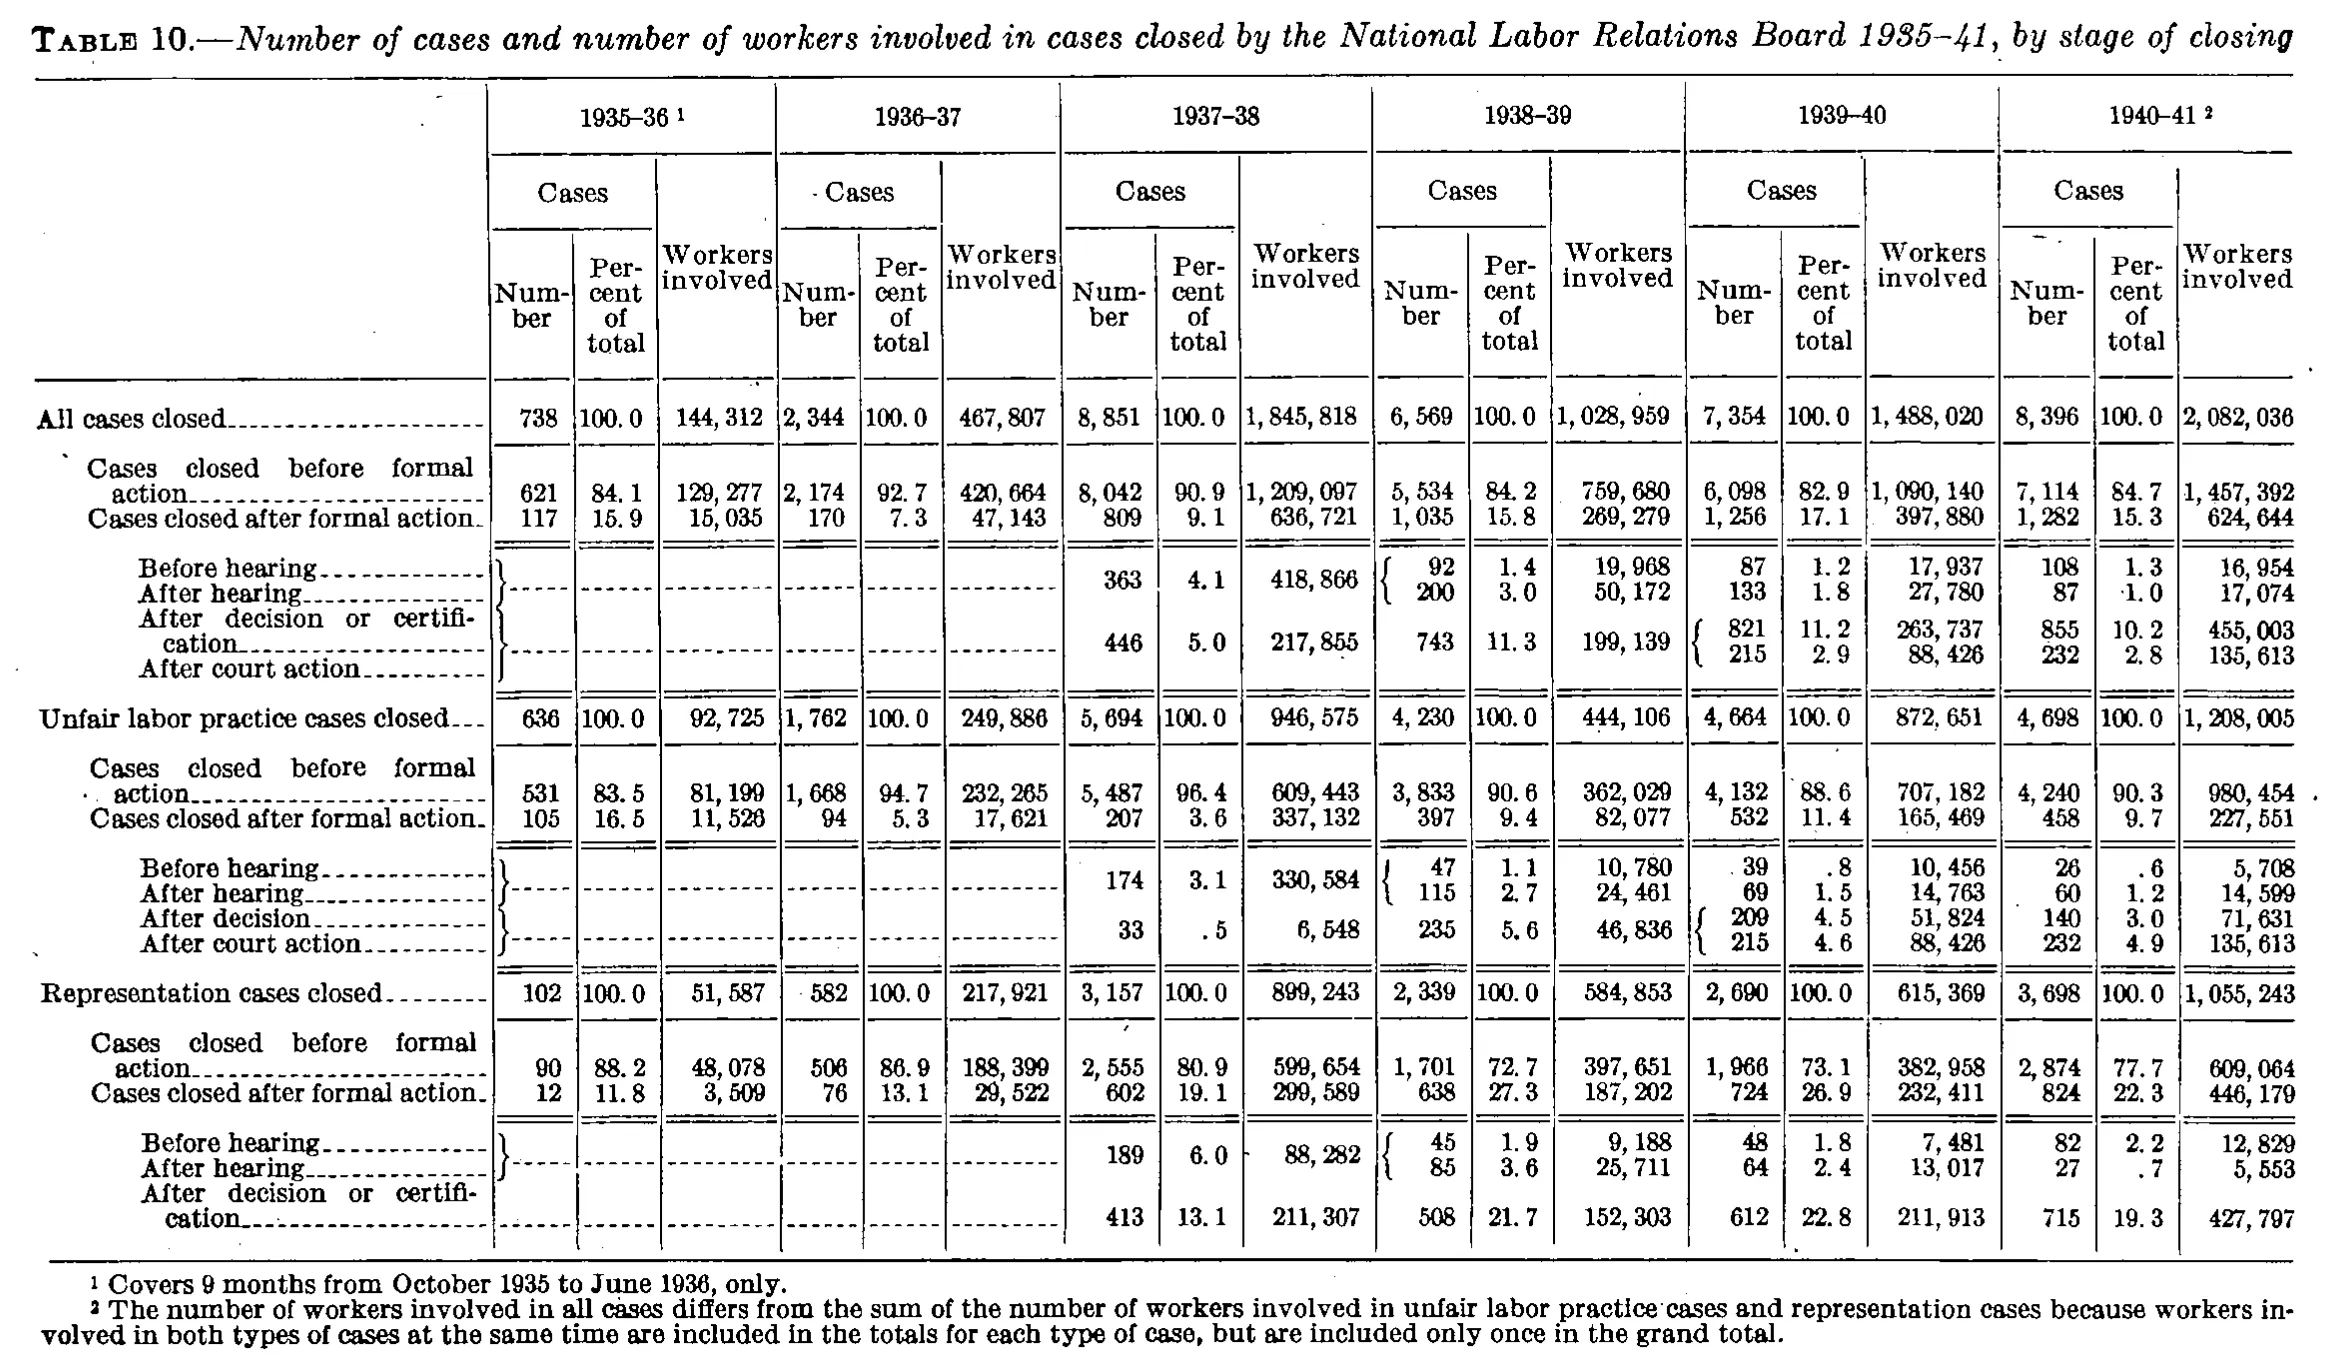
Number of cases and number of workers involved in cases closed by the National Labor Relations Board 1935-41, by stage of closing
| 1935-36 | 1936-37 | 1937-38 | 1938-39 | 1939-40 | 1940-41 | |||||||||||||
|---|---|---|---|---|---|---|---|---|---|---|---|---|---|---|---|---|---|---|
| Cases | Workers involved | Cases | Workers involved | Cases | Workers involved | Cases | Workers involved | Cases | Workers involved | Cases | Workers involved | |||||||
| Number | Percent of total | Workers involved | Number | Percent of total | Workers involved | Number | Percent of total | Workers involved | Number | Percent of total | Workers involved | Number | Percent of total | Workers involved | Number | Percent of total | Workers involved | |
| All cases closed | 738 | 100.0 | 144,312 | 2,344 | 100.0 | 467,807 | 8,851 | 100.0 | 1,845,818 | 6,569 | 100.0 | 1,028,959 | 7,354 | 100.0 | 1,488,020 | 8,396 | 100.0 | 2,082,036 |
| Cases closed before formal action | 621 | 84.1 | 129,277 | 2,174 | 92.7 | 420,664 | 8,042 | 90.9 | 1,209,097 | 5,534 | 84.2 | 759,680 | 6,098 | 82.9 | 1,090,140 | 7,114 | 84.7 | 1,457,392 |
| Cases closed after formal action | 117 | 15.9 | 15,035 | 170 | 7.3 | 47,143 | 809 | 9.1 | 636,721 | 1,035 | 15.8 | 269,279 | 1,256 | 17.1 | 397,880 | 1,282 | 15.3 | 624,644 |
| Before hearing | 363 | 4.1 | 418,866 | 92 | 1.4 | 19,968 | 87 | 1.2 | 17,937 | 108 | 1.3 | 16,954 | ||||||
| After hearing | 200 | 3.0 | 50,172 | 133 | 1.8 | 27,780 | 87 | 1.0 | 17,074 | |||||||||
| After decision or certification | 446 | 5.0 | 217,855 | 743 | 11.3 | 199,139 | 821 | 11.2 | 263,737 | 855 | 10.2 | 455,003 | ||||||
| After court action | 215 | 2.9 | 88,426 | 232 | 2.8 | 135,613 | ||||||||||||
| Unfair labor practice cases closed | 636 | 100.0 | 92,725 | 1,762 | 100.0 | 249,886 | 5,694 | 100.0 | 946,575 | 4,230 | 100.0 | 444,106 | 4,664 | 100.0 | 872,651 | 4,698 | 100.0 | 1,208,005 |
| Cases closed before formal action | 531 | 83.5 | 81,199 | 1,668 | 94.7 | 232,265 | 5,487 | 96.4 | 609,443 | 3,833 | 90.6 | 362,029 | 4,132 | 88.6 | 707,182 | 4,240 | 90.3 | 980,454 |
| Cases closed after formal action | 105 | 16.5 | 11,526 | 94 | 5.3 | 17,621 | 207 | 3.6 | 337,132 | 397 | 9.4 | 82,077 | 532 | 11.4 | 165,469 | 458 | 9.7 | 227,551 |
| Before hearing | 174 | 3.1 | 330,584 | 47 | 1.1 | 10,780 | 39 | .8 | 10,456 | 26 | .6 | 5,708 | ||||||
| After hearing | 115 | 2.7 | 24,461 | 69 | 1.5 | 14,763 | 60 | 1.2 | 14,599 | |||||||||
| After decision | 33 | .5 | 6,548 | 235 | 5.6 | 46,836 | 209 | 4.5 | 51,824 | 140 | 3.0 | 71,631 | ||||||
| After court action | 215 | 4.6 | 88,426 | 232 | 4.9 | 135,613 | ||||||||||||
| Representation cases closed | 102 | 100.0 | 51,587 | 582 | 100.0 | 217,921 | 3,157 | 100.0 | 899,243 | 2,339 | 100.0 | 584,853 | 2,690 | 100.0 | 615,369 | 3,698 | 100.0 | 1,055,243 |
| Cases closed before formal action | 90 | 88.2 | 48,078 | 506 | 86.9 | 188,399 | 2,555 | 80.9 | 599,654 | 1,701 | 72.7 | 397,651 | 1,966 | 73.1 | 382,958 | 2,874 | 77.7 | 609,064 |
| Cases closed after formal action | 12 | 11.8 | 3,509 | 76 | 13.1 | 29,522 | 602 | 19.1 | 299,589 | 638 | 27.3 | 187,202 | 724 | 26.9 | 232,411 | 824 | 22.3 | 446,179 |
| Before hearing | 189 | 6.0 | 88,282 | 45 | 1.9 | 9,188 | 48 | 1.8 | 7,481 | 82 | 2.2 | 12,829 | ||||||
| After hearing | 85 | 3.6 | 25,711 | 64 | 2.4 | 13,017 | 27 | .7 | 5,553 | |||||||||
| After decision or certification | 413 | 13.1 | 211,307 | 508 | 21.7 | 152,303 | 612 | 22.8 | 211,913 | 715 | 19.3 | 427,797 | ||||||
- 1 Covers 9 months from October 1935 to June 1936, only.
- 2 The number of workers involved in all cases differs from the sum of the number of workers involved in unfair labor practice cases and representation cases because workers involved in both types of cases at the same time are included in the totals for each type of case, but are included only once in the grand total.
108 of 182 figures sit in a row or column sum that works out.
Reader’s notes
p. 35. Structure: 19 columns (stub + six fiscal years x Number / Percent of total / Workers involved). The stub column has no printed heading, so the stub cell is empty in all three heading levels; "Workers involved" is a tall heading spanning heading levels 2 and 3 and is repeated there. Braced (shared) entries. The stage-of-closing detail rows carry printers' braces where one figure covers more than one stub line; I placed each printed figure in the row on whose line it is set and left the other row empty for that year: - 1935-36 and 1936-37: all four stage-detail rows in each section are covered by a single large brace in the stub and show only a dash rule, i.e. no figures were published; those 24 cells are "" by design, not illegible. - 1937-38: in each section one figure stands for "Before hearing" + "After hearing" (363 / 4.1 / 418,866 for all cases; 174 / 3.1 / 330,584 for unfair labor practice; 189 / 6.0 / 88,282 for representation) and one stands for "After decision (or certification)" + "After court action" (446 / 5.0 / 217,855; 33 / .5 / 6,548; 413 / 13.1 / 211,307). The brace sits between the 1937-38 and 1938-39 panels. - 1938-39: 743 / 11.3 / 199,139 (all cases) is braced against the 1939-40 pair 821 and 215, i.e. it covers "After decision or certification" + "After court action"; same for 235 / 5.6 / 46,836 in the unfair labor practice section. The "After court action" cells for 1937-38 and 1938-39 are therefore empty. Label wording: in the unfair labor practice section the third detail row is printed "After decision" (no "or certification"), unlike the corresponding rows in the other two sections; transcribed as printed. Doubtful cells: the 1940-41 "Percent of total" for the all-cases "After hearing" row is printed as 1.0 preceded by a small stray dot (rendered "·1.0"); 87 of 8,396 = 1.0 percent, so I read it as 1.0 and treat the dot as a speck rather than a leading decimal point or a footnote marker. Arithmetic: every component set sums to its printed total (cases and workers) in all six years and all three sections, and the percent columns agree with those counts, so no misprints are suspected.
Source image
Source data: U.S. NLRB Annual Reports (public domain). Reconstruction by NLRB Stats Archive. Read by claude-opus-5 (effort max, prompt extract_v1) from the 300-dpi scan; stitched by page. Updated October 2026.