NLRB Stats Archive › Annual Reports › FY1941 › Number of cases and number of workers involved in cases received by the National Labor Relations Board 1940-41, by regional offices
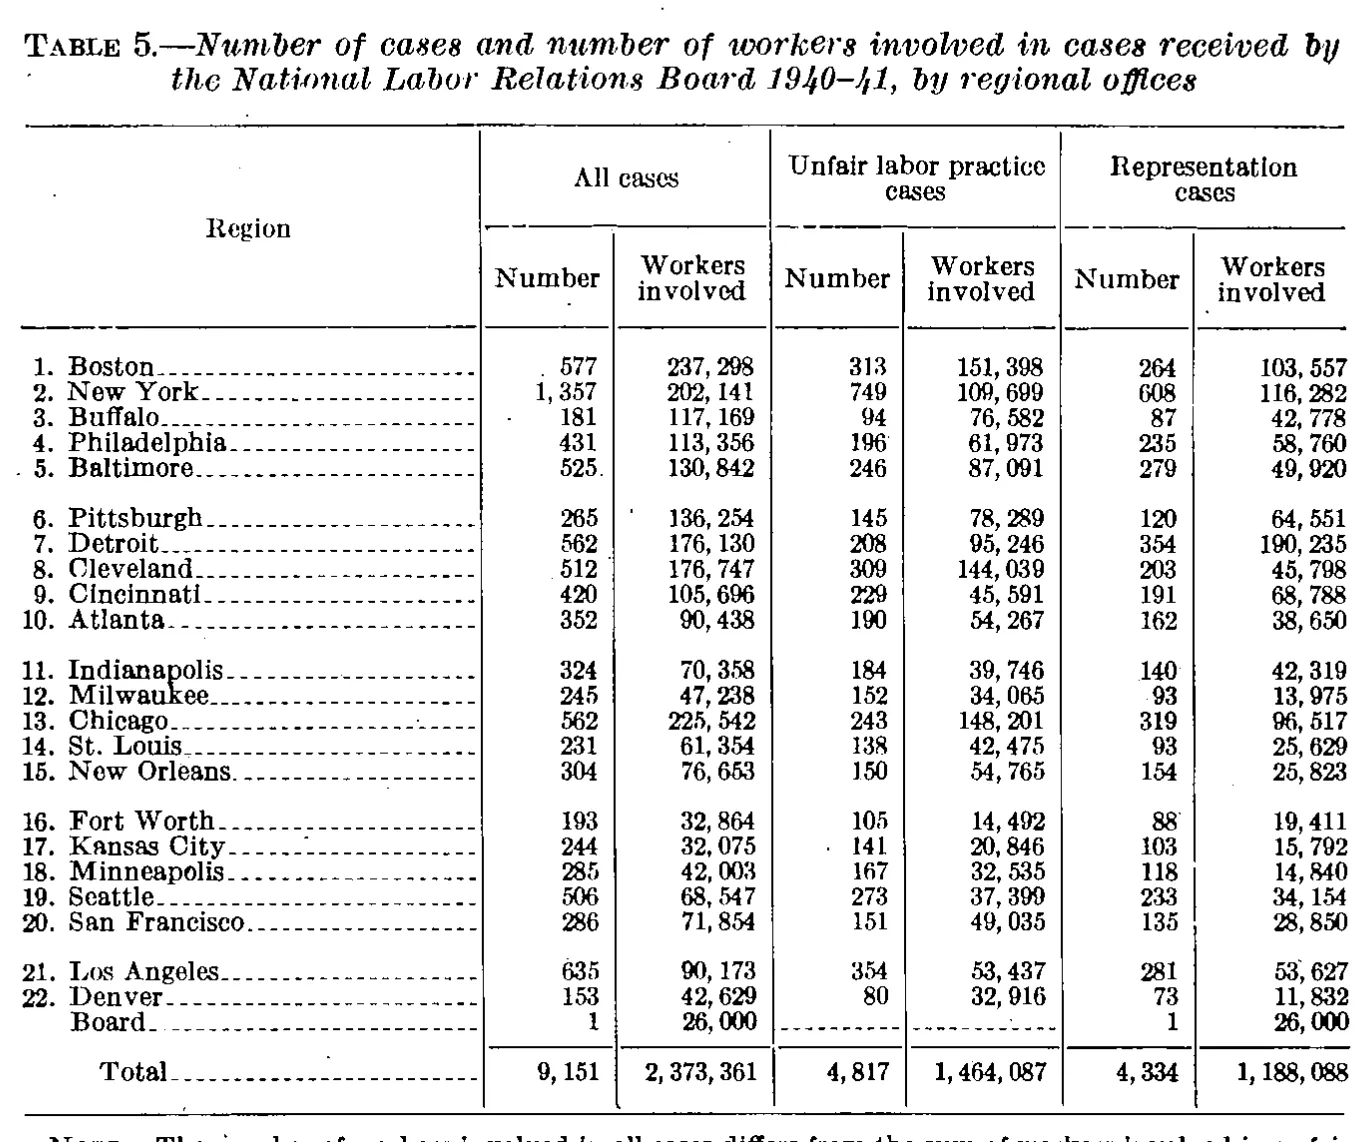
Number of cases and number of workers involved in cases received by the National Labor Relations Board 1940-41, by regional offices
| Region | All cases | Unfair labor practice cases | Representation cases | |||
|---|---|---|---|---|---|---|
| Region | Number | Workers involved | Number | Workers involved | Number | Workers involved |
| 1. Boston | 577 | 237,298 | 313 | 151,398 | 264 | 103,557 |
| 2. New York | 1,357 | 202,141 | 749 | 109,699 | 608 | 116,282 |
| 3. Buffalo | 181 | 117,169 | 94 | 76,582 | 87 | 42,778 |
| 4. Philadelphia | 431 | 113,356 | 196 | 61,973 | 235 | 58,760 |
| 5. Baltimore | 525 | 130,842 | 246 | 87,091 | 279 | 49,920 |
| 6. Pittsburgh | 265 | 136,254 | 145 | 78,289 | 120 | 64,551 |
| 7. Detroit | 562 | 176,130 | 208 | 95,246 | 354 | 190,235 |
| 8. Cleveland | 512 | 176,747 | 309 | 144,039 | 203 | 45,798 |
| 9. Cincinnati | 420 | 105,696 | 229 | 45,591 | 191 | 68,788 |
| 10. Atlanta | 352 | 90,438 | 190 | 54,267 | 162 | 38,650 |
| 11. Indianapolis | 324 | 70,358 | 184 | 39,746 | 140 | 42,319 |
| 12. Milwaukee | 245 | 47,238 | 152 | 34,065 | 93 | 13,975 |
| 13. Chicago | 562 | 225,542 | 243 | 148,201 | 319 | 96,517 |
| 14. St. Louis | 231 | 61,354 | 138 | 42,475 | 93 | 25,629 |
| 15. New Orleans | 304 | 76,653 | 150 | 54,765 | 154 | 25,823 |
| 16. Fort Worth | 193 | 32,864 | 105 | 14,492 | 88 | 19,411 |
| 17. Kansas City | 244 | 32,075 | 141 | 20,846 | 103 | 15,792 |
| 18. Minneapolis | 285 | 42,003 | 167 | 32,535 | 118 | 14,840 |
| 19. Seattle | 506 | 68,547 | 273 | 37,399 | 233 | 34,154 |
| 20. San Francisco | 286 | 71,854 | 151 | 49,035 | 135 | 28,850 |
| 21. Los Angeles | 635 | 90,173 | 354 | 53,437 | 281 | 53,627 |
| 22. Denver | 153 | 42,629 | 80 | 32,916 | 73 | 11,832 |
| Board | 1 | 26,000 | 1 | 26,000 | ||
| Total | 9,151 | 2,373,361 | 4,817 | 1,464,087 | 4,334 | 1,188,088 |
142 of 142 figures sit in a row or column sum that works out.
Reader’s notes
p. 31. Seven columns: stub plus three two-column panels (All cases / Unfair labor practice cases / Representation cases), each with Number and Workers involved. A general NOTE paragraph is printed below the table rule but is sliced off by the bottom edge of the crop: only the top halves of the letters of its first line survive, reading approximately "NOTE.—The number of workers involved in all cases differs from the sum of workers involved in ...". Because the remainder is not on this image, it is not transcribed in `footnotes`; it should be recovered from the full page. The "Board" row prints dash rules (------) in the two Unfair labor practice columns; these are rendered as empty cells. Arithmetic check (not a correction, just verification): all six data columns sum exactly to the printed Total row — 9,151 / 2,373,361 / 4,817 / 1,464,087 / 4,334 / 1,188,088 — so the digits are internally consistent. Note that for individual regions the "All cases" workers figure is not the sum of the two case-type workers figures (e.g. New York 202,141 vs 109,699 + 116,282); this is what the cut-off NOTE appears to explain, and nothing was altered. Minor stray ink: a few scanner specks sit in the number fields (e.g. before Buffalo's 181 and before Kansas City's 141); these are not footnote markers or digits and were ignored. "Cincinnati" is printed with a capital-I-like glyph for the second "i" ("CIncinnati") due to a type/scan artifact; transcribed as the intended "Cincinnati".
Source image
Source data: U.S. NLRB Annual Reports (public domain). Reconstruction by NLRB Stats Archive. Read by claude-opus-5 (effort max, prompt extract_v1) from the 300-dpi scan; stitched by page. Updated October 2026.