NLRB Stats Archive › Annual Reports › FY1941 › Cases and workers involved in cases received by the NLRB
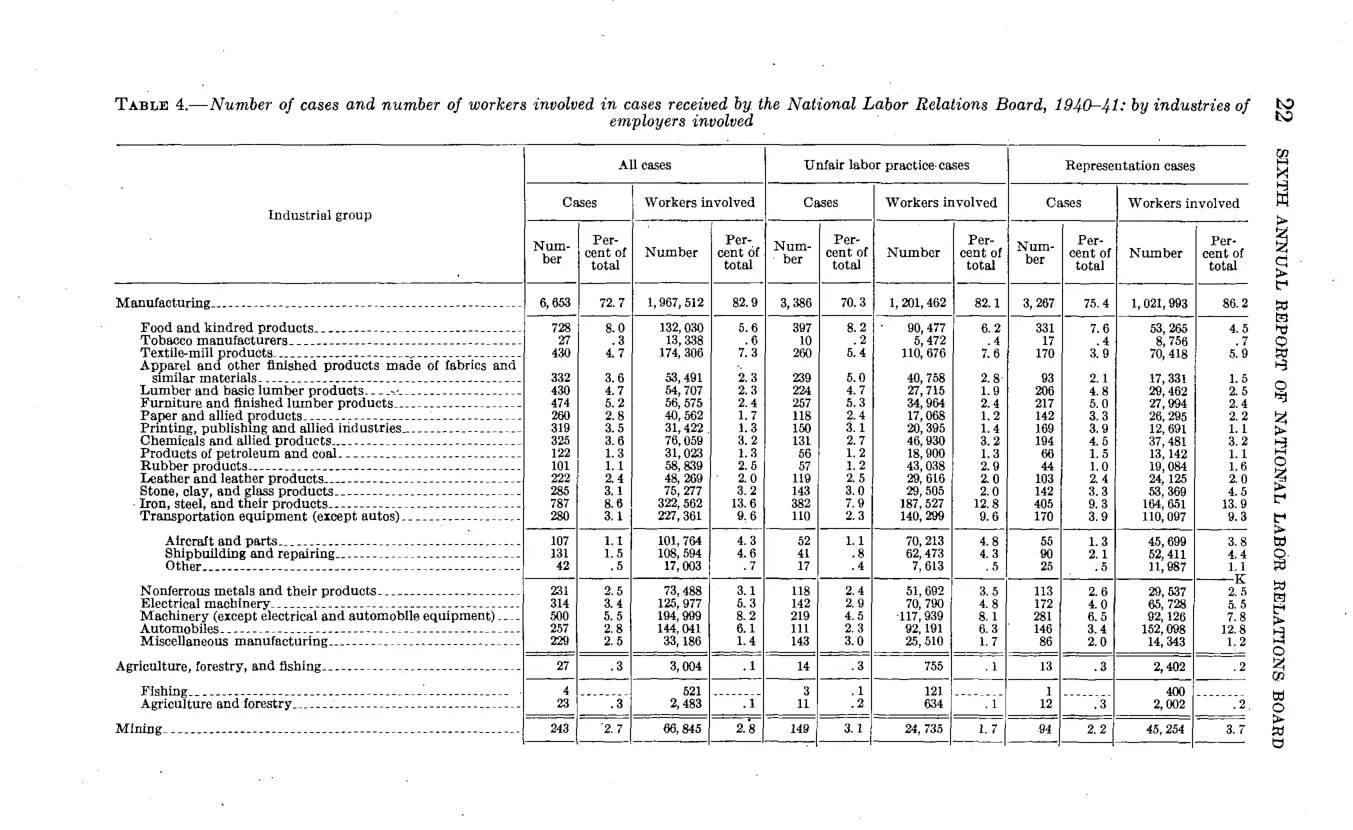
Cases and workers involved in cases received by the NLRB
| Industrial group | All cases — Cases — Number | All cases — Cases — Percent of total | All cases — Workers involved — Number | All cases — Workers involved — Percent of total | Unfair labor practice cases — Cases — Number | Unfair labor practice cases — Cases — Percent of total | Unfair labor practice cases — Workers involved — Number | Unfair labor practice cases — Workers involved — Percent of total | Representation cases — Cases — Number | Representation cases — Cases — Percent of total | Representation cases — Workers involved — Number | Representation cases — Workers involved — Percent of total |
|---|---|---|---|---|---|---|---|---|---|---|---|---|
| Manufacturing | 6,653 | 72.7 | 1,957,512 | 82.9 | 3,386 | 70.3 | 1,201,492 | 82.1 | 3,267 | 75.4 | 1,021,993 | 86 |
| Manufacturing: Food and kindred products | 726 | 8 | 132,030 | 5.6 | 397 | 8.3 | 78,775 | 5.4 | 329 | 7.6 | 53,255 | 4.5 |
| Manufacturing: Iron and steel and their products | 5,927 | |||||||||||
| Agriculture, forestry, and fishing | 27 | 0.3 | 3,004 | 0.1 | 14 | 0.3 | 755 | 0.1 | 13 | 0.3 | 2,492 | 0.2 |
| Mining | 243 | 2.7 | 66,845 | 2.8 | 149 | 3.1 | 21,560 | 1.7 | 94 | 2.2 | 45,254 | 3.7 |
Source image
Source data: U.S. NLRB Annual Reports (public domain). Reconstruction by NLRB Stats Archive. Updated June 2026.