NLRB Stats Archive › Annual Reports › FY1941 › Cases and workers involved in cases received by NLRB
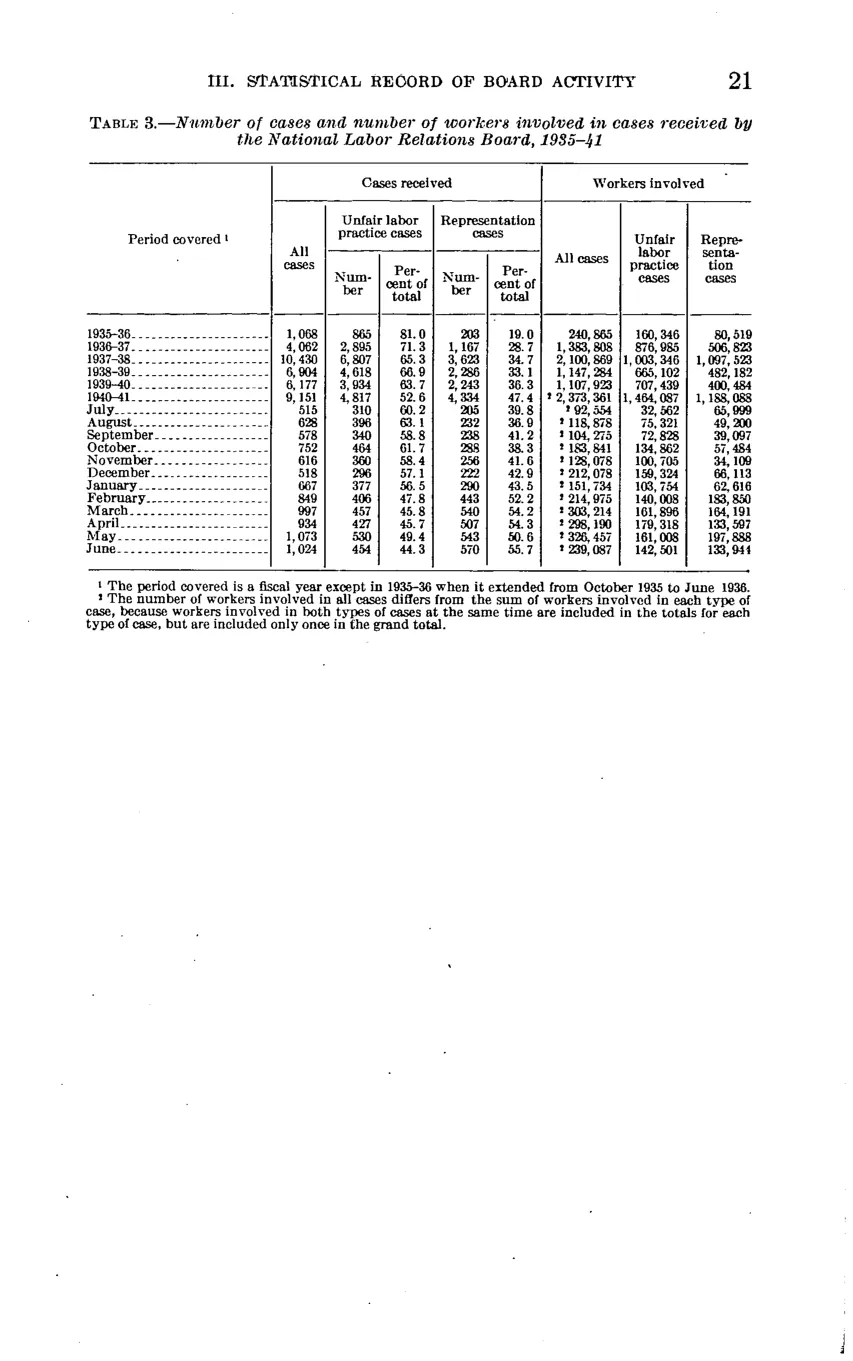
Cases and workers involved in cases received by NLRB
| Period covered | Cases received | Cases received | Cases received | Cases received | Cases received | Workers involved | Workers involved | Workers involved |
|---|---|---|---|---|---|---|---|---|
| Period covered | All cases | Unfair labor practice cases — Number | Unfair labor practice cases — Percent of total | Representation cases — Number | Representation cases — Percent of total | All cases | Unfair labor practice cases | Representation cases |
| 1935-36 | 1,068 | 865 | 81 | 203 | 19 | 240,865 | 160,346 | 80,519 |
| 1936-37 | 4,062 | 2,895 | 71.3 | 1,167 | 28.7 | 1,383,808 | 876,985 | 506,823 |
| 1937-38 | 10,430 | 6,807 | 65.3 | 3,623 | 34.7 | 2,100,869 | 1,003,346 | 1,097,523 |
| 1938-39 | 6,904 | 4,618 | 66.9 | 2,286 | 33.1 | 1,147,284 | 665,102 | 482,182 |
| 1939-40 | 6,177 | 3,934 | 63.7 | 2,243 | 36.3 | 1,107,923 | 707,439 | 400,484 |
| 1940-41 | 9,151 | 4,817 | 52.6 | 4,334 | 47.4 | 2,373,361 | 1,464,087 | 1,188,088 |
| July (1940) | 515 | 310 | 60.2 | 205 | 39.8 | 92,554 | 32,562 | 65,999 |
| August | 628 | 396 | 63.1 | 232 | 36.9 | 118,878 | 75,321 | 49,200 |
| September | 578 | 340 | 58.8 | 238 | 41.2 | 104,275 | 72,828 | 39,097 |
| October | 752 | 464 | 61.7 | 288 | 38.3 | 182,841 | 134,862 | 57,484 |
| November | 616 | 360 | 58.4 | 256 | 41.6 | 128,076 | 100,705 | 34,109 |
| December | 518 | 296 | 57.1 | 222 | 42.9 | 212,078 | 159,324 | 66,113 |
| January (1941) | 667 | 377 | 56.5 | 290 | 43.5 | 151,734 | 103,754 | 62,616 |
| February | 849 | 406 | 47.8 | 443 | 52.2 | 214,975 | 140,008 | 153,850 |
| March | 997 | 457 | 45.8 | 540 | 54.2 | 303,214 | 161,396 | 164,191 |
| April | 934 | 427 | 45.7 | 507 | 54.3 | 298,190 | 179,318 | 133,597 |
| May | 1,073 | 530 | 49.4 | 543 | 50.6 | 326,457 | 161,008 | 197,888 |
| June | 1,024 | 454 | 44.3 | 570 | 55.7 | 239,087 | 142,501 | 133,944 |
Source image
Source data: U.S. NLRB Annual Reports (public domain). Reconstruction by NLRB Stats Archive. Updated June 2026.