NLRB Stats Archive › Annual Reports › FY1940 › Number of cases brought before the National Labor Relations Board and number of strikes, by month, October 1935–June 1940
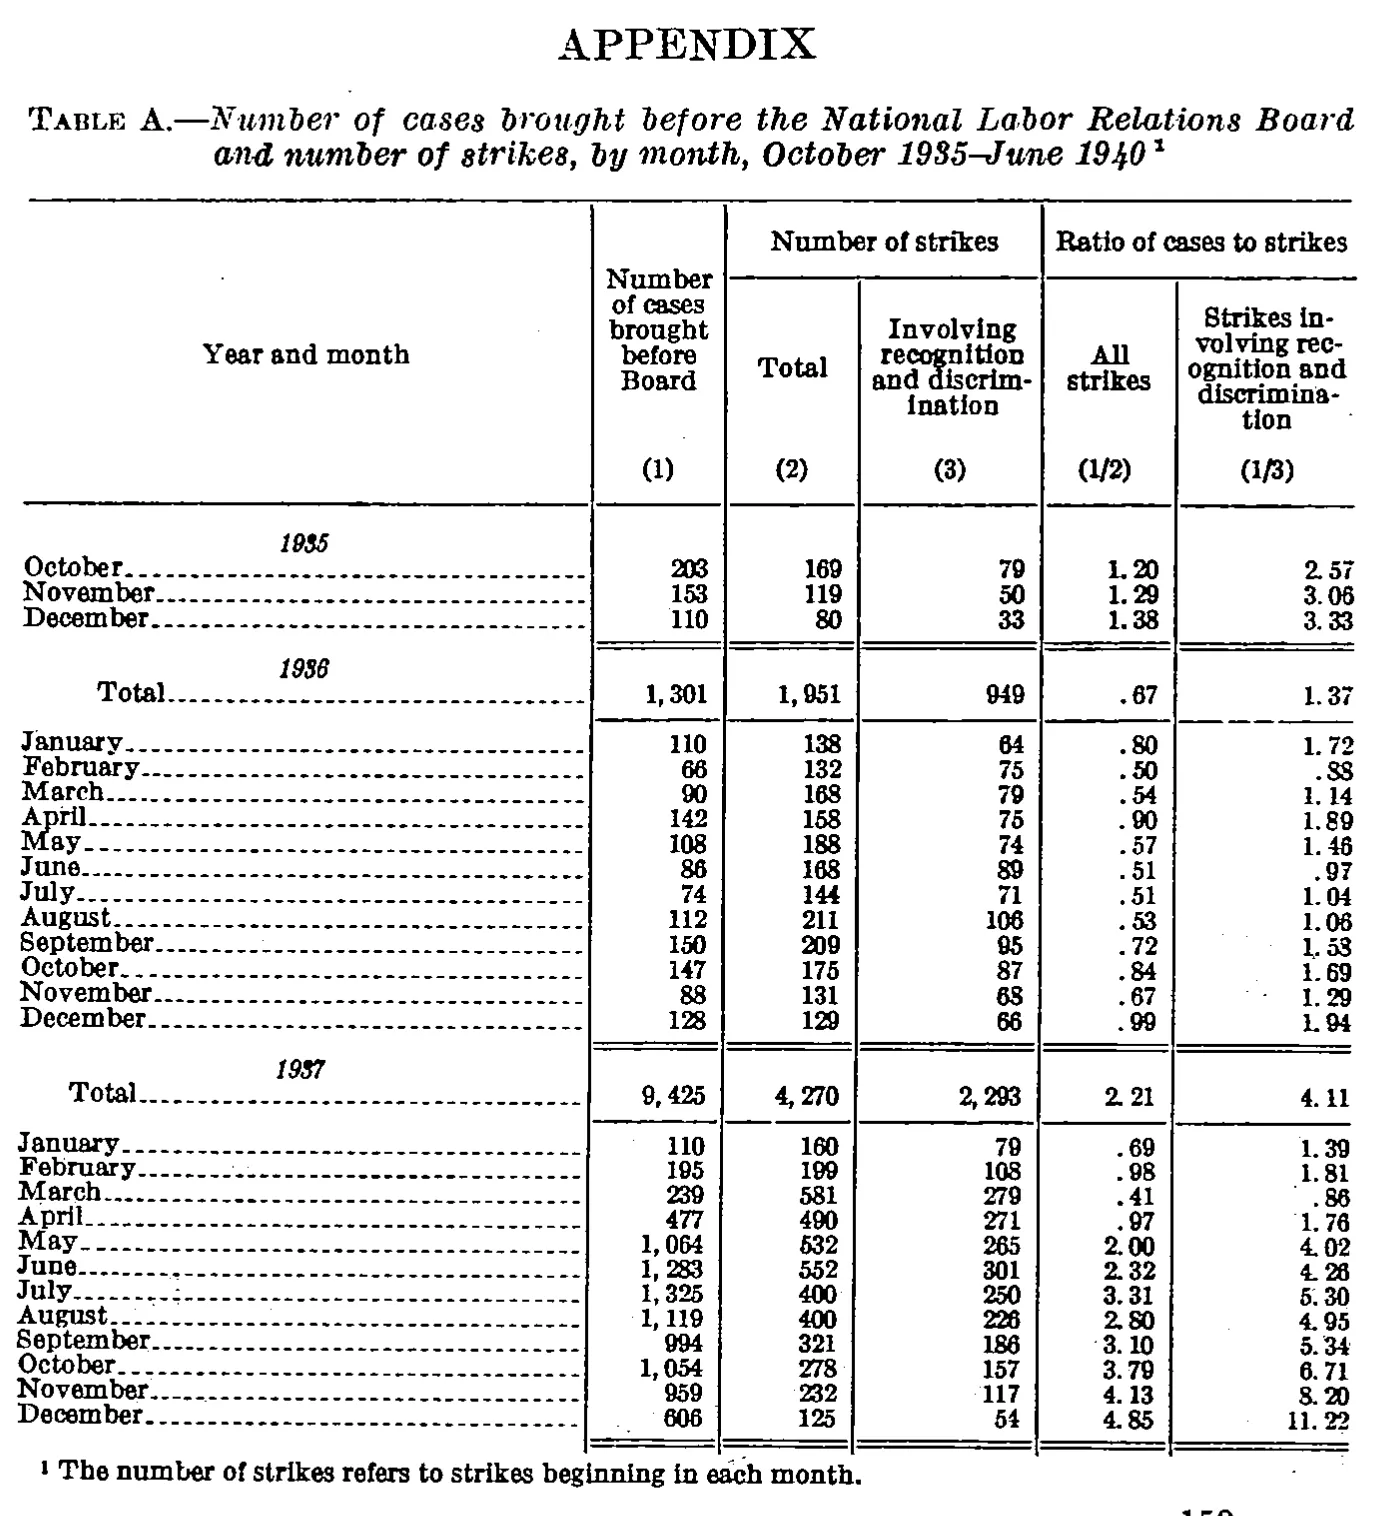
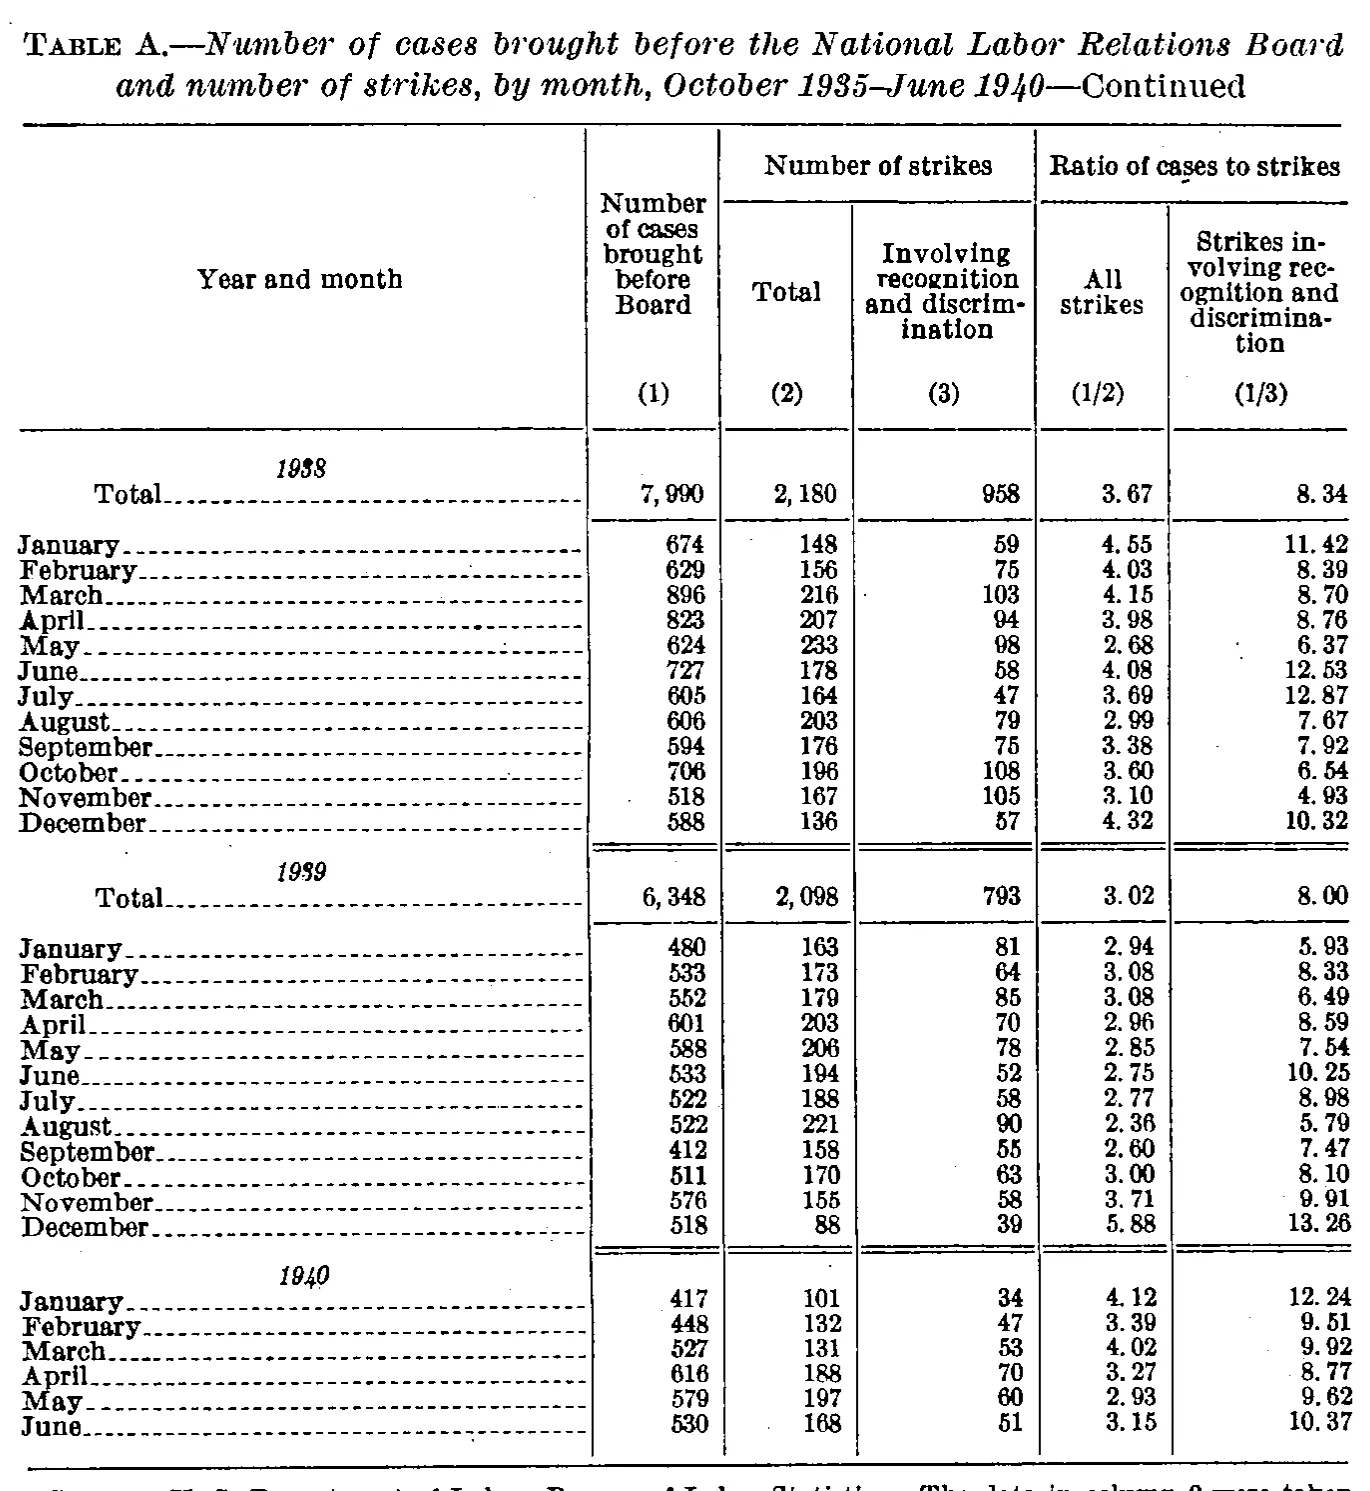
Number of cases brought before the National Labor Relations Board and number of strikes, by month, October 1935–June 1940
Stitched from pp. 166–167.
| Year and month | Number of cases brought before Board | Number of strikes | Ratio of cases to strikes | ||
|---|---|---|---|---|---|
| Year and month | Number of cases brought before Board | Total | Involving recognition and discrimination | All strikes | Strikes involving recognition and discrimination |
| Year and month | [1] | [2] | [3] | [1/2] | [1/3] |
| 1935 | |||||
| October | 203 | 169 | 79 | 1.20 | 2.57 |
| November | 153 | 119 | 50 | 1.29 | 3.06 |
| December | 110 | 80 | 33 | 1.38 | 3.33 |
| 1936 | |||||
| Total | 1,301 | 1,951 | 949 | .67 | 1.37 |
| January | 110 | 138 | 64 | .80 | 1.72 |
| February | 66 | 132 | 75 | .50 | .88 |
| March | 90 | 168 | 79 | .54 | 1.14 |
| April | 142 | 158 | 75 | .90 | 1.89 |
| May | 108 | 188 | 74 | .57 | 1.46 |
| June | 86 | 168 | 89 | .51 | .97 |
| July | 74 | 144 | 71 | .51 | 1.04 |
| August | 112 | 211 | 106 | .53 | 1.06 |
| September | 150 | 209 | 95 | .72 | 1.53 |
| October | 147 | 175 | 87 | .84 | 1.69 |
| November | 88 | 131 | 68 | .67 | 1.29 |
| December | 128 | 129 | 66 | .99 | 1.94 |
| 1937 | |||||
| Total | 9,425 | 4,270 | 2,293 | 2.21 | 4.11 |
| January | 110 | 160 | 79 | .69 | 1.39 |
| February | 195 | 199 | 108 | .98 | 1.81 |
| March | 239 | 581 | 279 | .41 | .86 |
| April | 477 | 490 | 271 | .97 | 1.76 |
| May | 1,064 | 532 | 265 | 2.00 | 4.02 |
| June | 1,283 | 552 | 301 | 2.32 | 4.26 |
| July | 1,325 | 400 | 250 | 3.31 | 5.30 |
| August | 1,119 | 400 | 226 | 2.80 | 4.95 |
| September | 994 | 321 | 186 | 3.10 | 5.34 |
| October | 1,054 | 278 | 157 | 3.79 | 6.71 |
| November | 959 | 232 | 117 | 4.13 | 8.20 |
| December | 606 | 125 | 54 | 4.85 | 11.22 |
| 1938 | |||||
| Total | 7,990 | 2,180 | 958 | 3.67 | 8.34 |
| January | 674 | 148 | 59 | 4.55 | 11.42 |
| February | 629 | 156 | 75 | 4.03 | 8.39 |
| March | 896 | 216 | 103 | 4.15 | 8.70 |
| April | 823 | 207 | 94 | 3.98 | 8.76 |
| May | 624 | 233 | 98 | 2.68 | 6.37 |
| June | 727 | 178 | 58 | 4.08 | 12.53 |
| July | 605 | 164 | 47 | 3.69 | 12.87 |
| August | 606 | 203 | 79 | 2.99 | 7.67 |
| September | 594 | 176 | 75 | 3.38 | 7.92 |
| October | 706 | 196 | 108 | 3.60 | 6.54 |
| November | 518 | 167 | 105 | 3.10 | 4.93 |
| December | 588 | 136 | 57 | 4.32 | 10.32 |
| 1939 | |||||
| Total | 6,348 | 2,098 | 793 | 3.02 | 8.00 |
| January | 480 | 163 | 81 | 2.94 | 5.93 |
| February | 533 | 173 | 64 | 3.08 | 8.33 |
| March | 552 | 179 | 85 | 3.08 | 6.49 |
| April | 601 | 203 | 70 | 2.96 | 8.59 |
| May | 588 | 206 | 78 | 2.85 | 7.54 |
| June | 533 | 194 | 52 | 2.75 | 10.25 |
| July | 522 | 188 | 58 | 2.77 | 8.98 |
| August | 522 | 221 | 90 | 2.36 | 5.79 |
| September | 412 | 158 | 55 | 2.60 | 7.47 |
| October | 511 | 170 | 63 | 3.00 | 8.10 |
| November | 576 | 155 | 58 | 3.71 | 9.91 |
| December | 518 | 88 | 39 | 5.88 | 13.26 |
| 1940 | |||||
| January | 417 | 101 | 34 | 4.12 | 12.24 |
| February | 448 | 132 | 47 | 3.39 | 9.51 |
| March | 527 | 131 | 53 | 4.02 | 9.92 |
| April | 616 | 188 | 70 | 3.27 | 8.77 |
| May | 579 | 197 | 60 | 2.93 | 9.62 |
| June | 530 | 168 | 51 | 3.15 | 10.37 |
- 1 The number of strikes refers to strikes beginning in each month.
156 of 183 figures sit in a row or column sum that works out.
Reader’s notes
p. 166. Six columns: stub plus (1), (2), (3), (1/2), (1/3). The years 1935, 1936 and 1937 are printed as centered italic section lines carrying no values; within the 1936 and 1937 blocks the "Total" row is printed above that year's monthly rows, not below them (the printed totals equal the sums of the twelve months that follow, confirming the block assignment). Doubtful cell: September 1936, column (1/3) — the second decimal glyph is degraded and I read it as "1.53", but 150/95 = 1.58 and every other ratio on the page agrees with its own row to the penny, so this is plausibly a scan-damaged "1.58"; transcribed as read. Also degraded but confirmed by the column sums: February 1936 (1/3) ".88", November 1936 (3) "68", December 1936 (1) "128". The caption states the table covers October 1935-June 1940, but this page stops at December 1937, so the table continues on the following page.
p. 167. Six printed columns: stub plus columns (1), (2), (3), (1/2), (1/3). The headings "Year and month" and "Number of cases brought before Board" are tall headings spanning the top two heading levels, so they are repeated there; the column-number line ((1)...(1/3)) is the third heading level. The years 1938, 1939 and 1940 are printed as centred italic section lines with no values; the 1940 section has no Total row (the fiscal/calendar year is incomplete, ending with June). Arithmetic as printed: the 1938 section is internally consistent (months sum to the printed totals and both ratio columns reproduce (1)/(2) and (1)/(3)). In 1939 and 1940 the monthly figures still sum exactly to the printed 1939 totals, but most entries in the last column (1/3) run about 0.02-0.03 below the quotient of the printed columns (1) and (3) — e.g. July 1939, 522/58 = 9.00 but 8.98 is printed; August 1939, 522/90 = 5.80 but 5.79 is printed; April 1940, 616/70 = 8.80 but 8.77 is printed. Nothing was computed or corrected; all cells are as printed. The first section year is set in italic type in which the "8" closely resembles a "3"; it is read as 1938 on the strength of the 1939/1940 sequence that follows. A source line is printed below the table at the very bottom edge of the crop and is sliced horizontally, leaving only the tops of the letters; it appears to begin "Source: U. S. Department of Labor, Bureau of Labor Statistics." followed by a sentence about the data in column 3, but it cannot be read reliably and so is not transcribed in `footnotes`. There are no numbered footnote markers anywhere in the table body or headings.
Source image
Source data: U.S. NLRB Annual Reports (public domain). Reconstruction by NLRB Stats Archive. Read by claude-opus-5 (effort max, prompt extract_v1) from the 300-dpi scan; stitched by page. Updated October 2026.