NLRB Stats Archive › Annual Reports › FY1940 › Number of elections participated in, won, and lost during the fiscal year: by different types of labor organizations
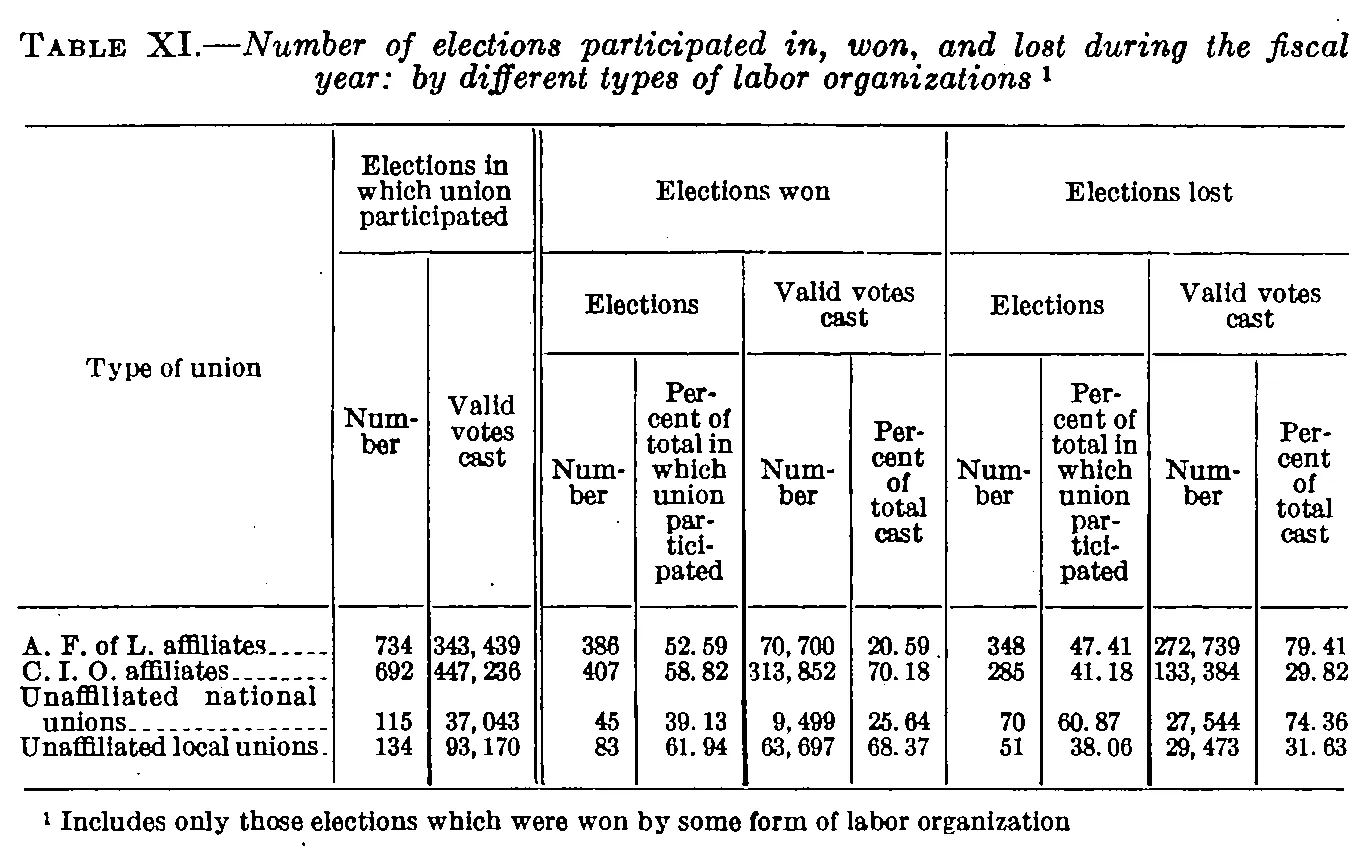
Number of elections participated in, won, and lost during the fiscal year: by different types of labor organizations
| Type of union | Elections in which union participated | Elections won | Elections lost | |||||||
|---|---|---|---|---|---|---|---|---|---|---|
| Type of union | Elections in which union participated | Elections | Valid votes cast | Elections | Valid votes cast | |||||
| Type of union | Number | Valid votes cast | Number | Percent of total in which union participated | Number | Percent of total cast | Number | Percent of total in which union participated | Number | Percent of total cast |
| A. F. of L. affiliates | 734 | 343,439 | 386 | 52.59 | 70,700 | 20.59 | 348 | 47.41 | 272,739 | 79.41 |
| C. I. O. affiliates | 692 | 447,236 | 407 | 58.82 | 313,852 | 70.18 | 285 | 41.18 | 133,384 | 29.82 |
| Unaffiliated national unions | 115 | 37,043 | 45 | 39.13 | 9,499 | 25.64 | 70 | 60.87 | 27,544 | 74.36 |
| Unaffiliated local unions | 134 | 93,170 | 83 | 61.94 | 63,697 | 68.37 | 51 | 38.06 | 29,473 | 31.63 |
- 1 Includes only those elections which were won by some form of labor organization
0 of 24 figures sit in a row or column sum that works out.
Reader’s notes
p. 37. The table has 11 columns: the stub plus two columns under "Elections in which union participated" and four each under "Elections won" and "Elections lost". The group heading "Elections in which union participated" spans the first two heading levels, so it is repeated there; "Type of union" spans all three levels. The caption carries footnote marker 1, but the caption is excluded per instructions, so the marker appears only on the footnote text. Percentages are printed with a space after the decimal point ("52. 59"); the space has been removed. The body has no total row. All printed percentages check out against the printed counts (e.g. 386/734 = 52.59, 70,700/343,439 = 20.59), so no misprints are suspected. The glyph read as "386" for A. F. of L. affiliates, Elections won / Elections / Number is slightly broken in the scan but is confirmed by the 52.59 percent and by 734 - 348 = 386.
Source image
Source data: U.S. NLRB Annual Reports (public domain). Reconstruction by NLRB Stats Archive. Read by claude-opus-5 (effort max, prompt extract_v1) from the 300-dpi scan; stitched by page. Updated October 2026.