NLRB Stats Archive › Annual Reports › FY1940 › Types of formal action taken in representation cases during the fiscal year: by regions
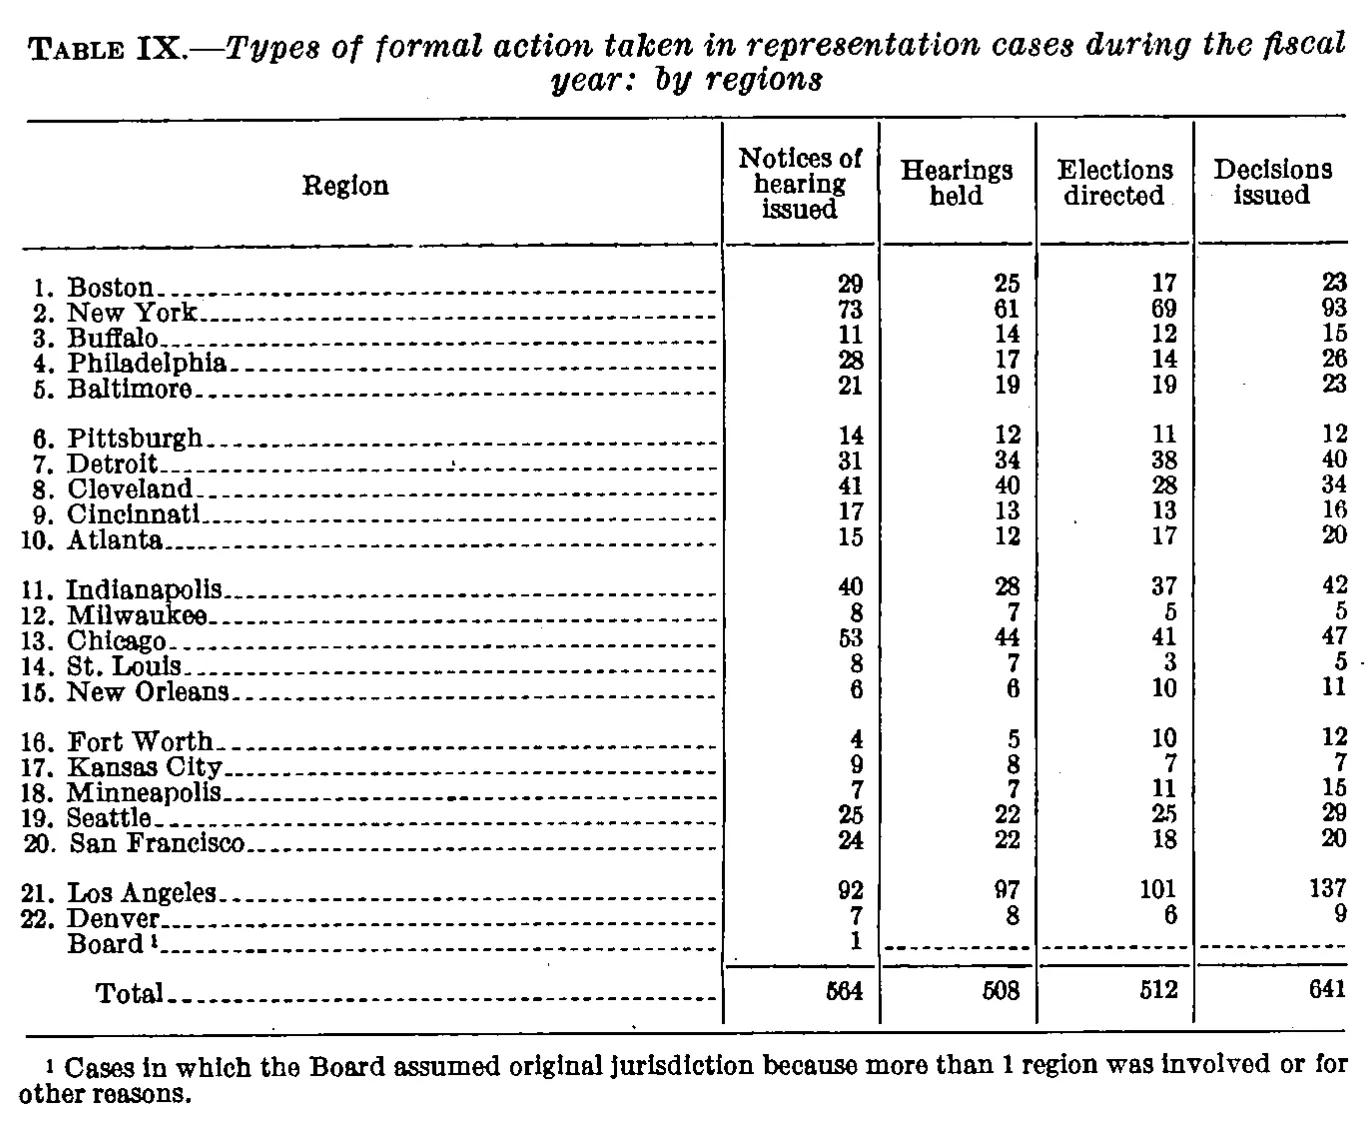
Types of formal action taken in representation cases during the fiscal year: by regions
| Region | Notices of hearing issued | Hearings held | Elections directed | Decisions issued |
|---|---|---|---|---|
| 1. Boston | 29 | 25 | 17 | 23 |
| 2. New York | 73 | 61 | 69 | 93 |
| 3. Buffalo | 11 | 14 | 12 | 15 |
| 4. Philadelphia | 28 | 17 | 14 | 26 |
| 5. Baltimore | 21 | 19 | 19 | 23 |
| 6. Pittsburgh | 14 | 12 | 11 | 12 |
| 7. Detroit | 31 | 34 | 38 | 40 |
| 8. Cleveland | 41 | 40 | 28 | 34 |
| 9. Cincinnati | 17 | 13 | 13 | 16 |
| 10. Atlanta | 15 | 12 | 17 | 20 |
| 11. Indianapolis | 40 | 28 | 37 | 42 |
| 12. Milwaukee | 8 | 7 | 5 | 5 |
| 13. Chicago | 53 | 44 | 41 | 47 |
| 14. St. Louis | 8 | 7 | 3 | 5 |
| 15. New Orleans | 6 | 6 | 10 | 11 |
| 16. Fort Worth | 4 | 5 | 10 | 12 |
| 17. Kansas City | 9 | 8 | 7 | 7 |
| 18. Minneapolis | 7 | 7 | 11 | 15 |
| 19. Seattle | 25 | 22 | 25 | 29 |
| 20. San Francisco | 24 | 22 | 18 | 20 |
| 21. Los Angeles | 92 | 97 | 101 | 137 |
| 22. Denver | 7 | 8 | 6 | 9 |
| Board | 1 | |||
| Total | 564 | 508 | 512 | 641 |
- 1 Cases in which the Board assumed original jurisdiction because more than 1 region was involved or for other reasons.
93 of 93 figures sit in a row or column sum that works out.
Reader’s notes
p. 35. Single-panel table, 5 columns (stub plus 4 data columns), one heading level. The "Board^1" row prints a value (1) only in the first data column; the other three columns carry dash rules, transcribed as empty cells. All four column totals as printed agree with the sum of the rows above them (564, 508, 512, 641). The scan carries stray specks (e.g. near "7. Detroit" in the stub and in the Elections-directed column beside "9. Cincinnati"); these are not printed characters. The "Total" figure in the Notices-of-hearing-issued column is slightly blotted but reads 564, consistent with the column sum.
Source image
Source data: U.S. NLRB Annual Reports (public domain). Reconstruction by NLRB Stats Archive. Read by claude-opus-5 (effort max, prompt extract_v1) from the 300-dpi scan; stitched by page. Updated October 2026.