NLRB Stats Archive › Annual Reports › FY1940 › Types of formal action taken in unfair labor practice cases during the fiscal year: by regions
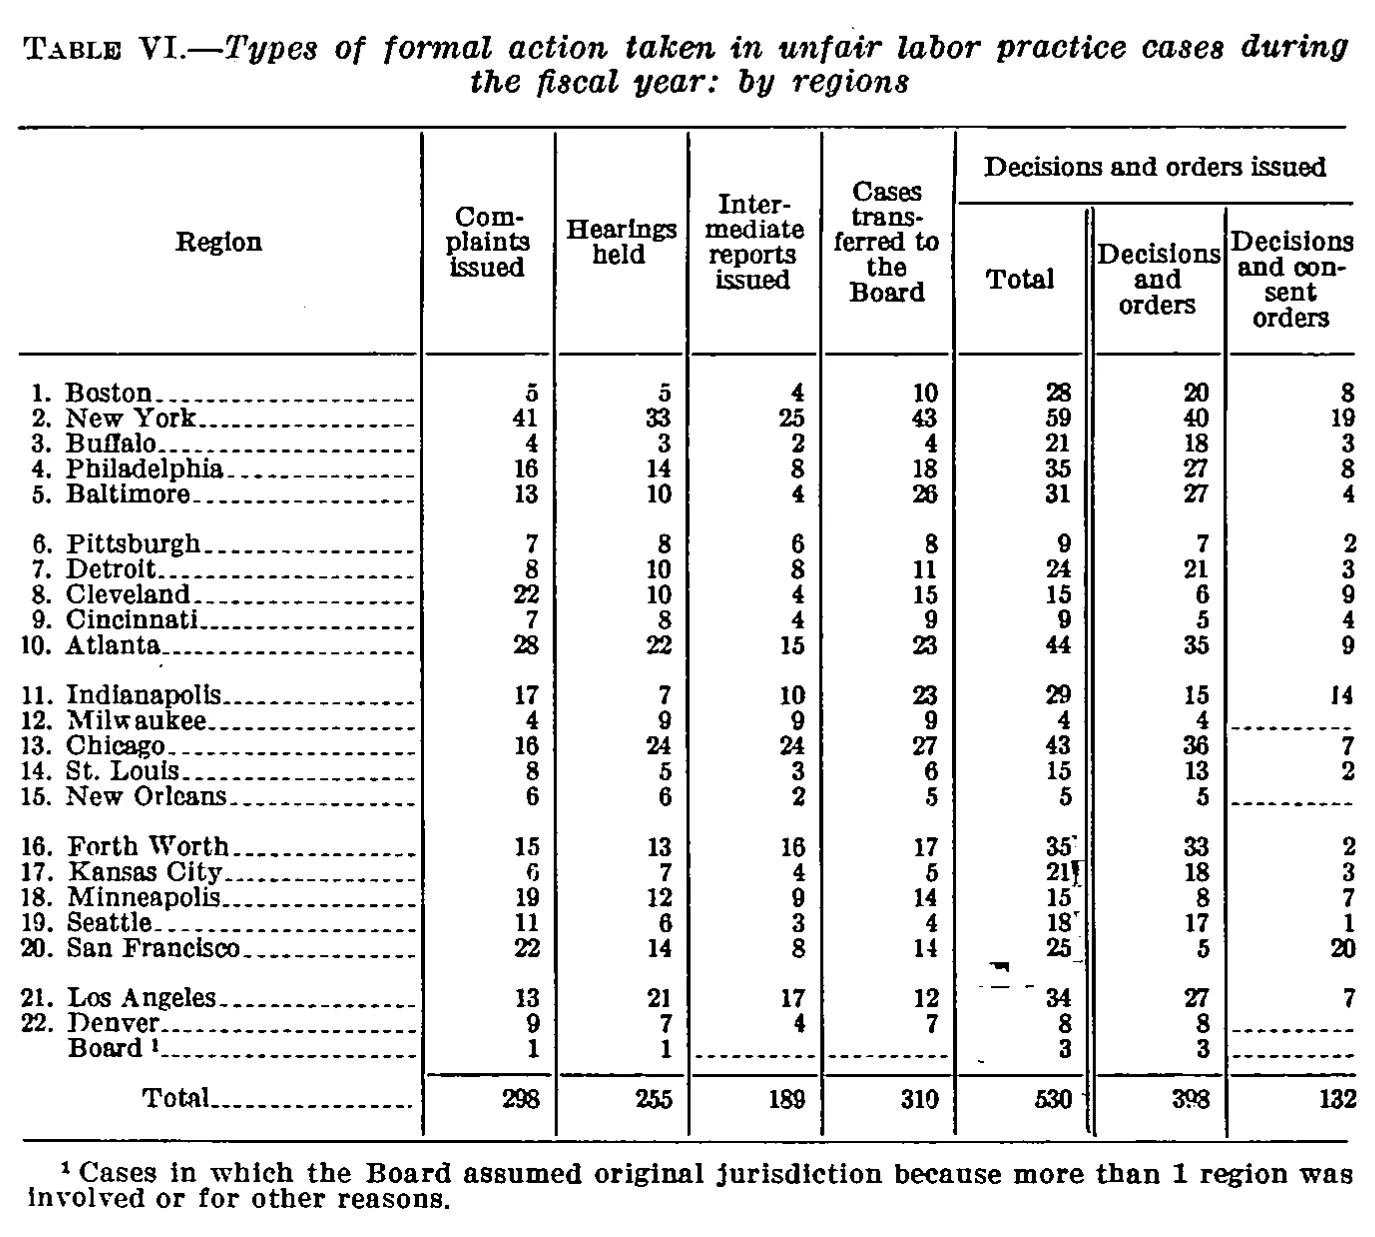
Types of formal action taken in unfair labor practice cases during the fiscal year: by regions
| Region | Complaints issued | Hearings held | Intermediate reports issued | Cases transferred to the Board | Decisions and orders issued | ||
|---|---|---|---|---|---|---|---|
| Region | Complaints issued | Hearings held | Intermediate reports issued | Cases transferred to the Board | Total | Decisions and orders | Decisions and consent orders |
| 1. Boston | 5 | 5 | 4 | 10 | 28 | 20 | 8 |
| 2. New York | 41 | 33 | 25 | 43 | 59 | 40 | 19 |
| 3. Buffalo | 4 | 3 | 2 | 4 | 21 | 18 | 3 |
| 4. Philadelphia | 16 | 14 | 8 | 18 | 35 | 27 | 8 |
| 5. Baltimore | 13 | 10 | 4 | 26 | 31 | 27 | 4 |
| 6. Pittsburgh | 7 | 8 | 6 | 8 | 9 | 7 | 2 |
| 7. Detroit | 8 | 10 | 8 | 11 | 24 | 21 | 3 |
| 8. Cleveland | 22 | 10 | 4 | 15 | 15 | 6 | 9 |
| 9. Cincinnati | 7 | 8 | 4 | 9 | 9 | 5 | 4 |
| 10. Atlanta | 28 | 22 | 15 | 23 | 44 | 35 | 9 |
| 11. Indianapolis | 17 | 7 | 10 | 23 | 29 | 15 | 14 |
| 12. Milwaukee | 4 | 9 | 9 | 9 | 4 | 4 | |
| 13. Chicago | 16 | 24 | 24 | 27 | 43 | 36 | 7 |
| 14. St. Louis | 8 | 5 | 3 | 6 | 15 | 13 | 2 |
| 15. New Orleans | 6 | 6 | 2 | 5 | 5 | 5 | |
| 16. Forth Worth | 15 | 13 | 16 | 17 | 35 | 33 | 2 |
| 17. Kansas City | 6 | 7 | 4 | 5 | 21 | 18 | 3 |
| 18. Minneapolis | 19 | 12 | 9 | 14 | 15 | 8 | 7 |
| 19. Seattle | 11 | 6 | 3 | 4 | 18 | 17 | 1 |
| 20. San Francisco | 22 | 14 | 8 | 14 | 25 | 5 | 20 |
| 21. Los Angeles | 13 | 21 | 17 | 12 | 34 | 27 | 7 |
| 22. Denver | 9 | 7 | 4 | 7 | 8 | 8 | |
| Board | 1 | 1 | 3 | 3 | |||
| Total | 298 | 255 | 189 | 310 | 530 | 398 | 132 |
- 1 Cases in which the Board assumed original jurisdiction because more than 1 region was involved or for other reasons.
162 of 162 figures sit in a row or column sum that works out.
Reader’s notes
p. 32. All seven numeric columns were checked against the printed Total row and every one adds up exactly (298, 255, 189, 310, 530, 398, 132), so the digits and their column placement are well corroborated. Row 16 is printed "Forth Worth" (apparent misprint for "Fort Worth"); transcribed as printed. Cells shown as a dash rule (------) rather than a figure, transcribed as "": "Decisions and consent orders" for Milwaukee, New Orleans, Denver and Board; and "Intermediate reports issued" and "Cases transferred to the Board" for the Board row. Minor scan artifacts, none affecting the readings: a stray ink mark sits in the "Cases transferred to the Board" column beside the San Francisco and Los Angeles rows, and faint tick marks trail the "Total" (decisions) figures for Forth Worth (35), Kansas City (21), Seattle (18) and San Francisco (25). Kansas City's "Complaints issued" 6 is slightly broken in the scan but is confirmed by the column total.
Source image
Source data: U.S. NLRB Annual Reports (public domain). Reconstruction by NLRB Stats Archive. Read by claude-opus-5 (effort max, prompt extract_v1) from the 300-dpi scan; stitched by page. Updated October 2026.