NLRB Stats Archive › Annual Reports › FY1940 › Types of unfair labor practices alleged in cases received during fiscal year: by regions
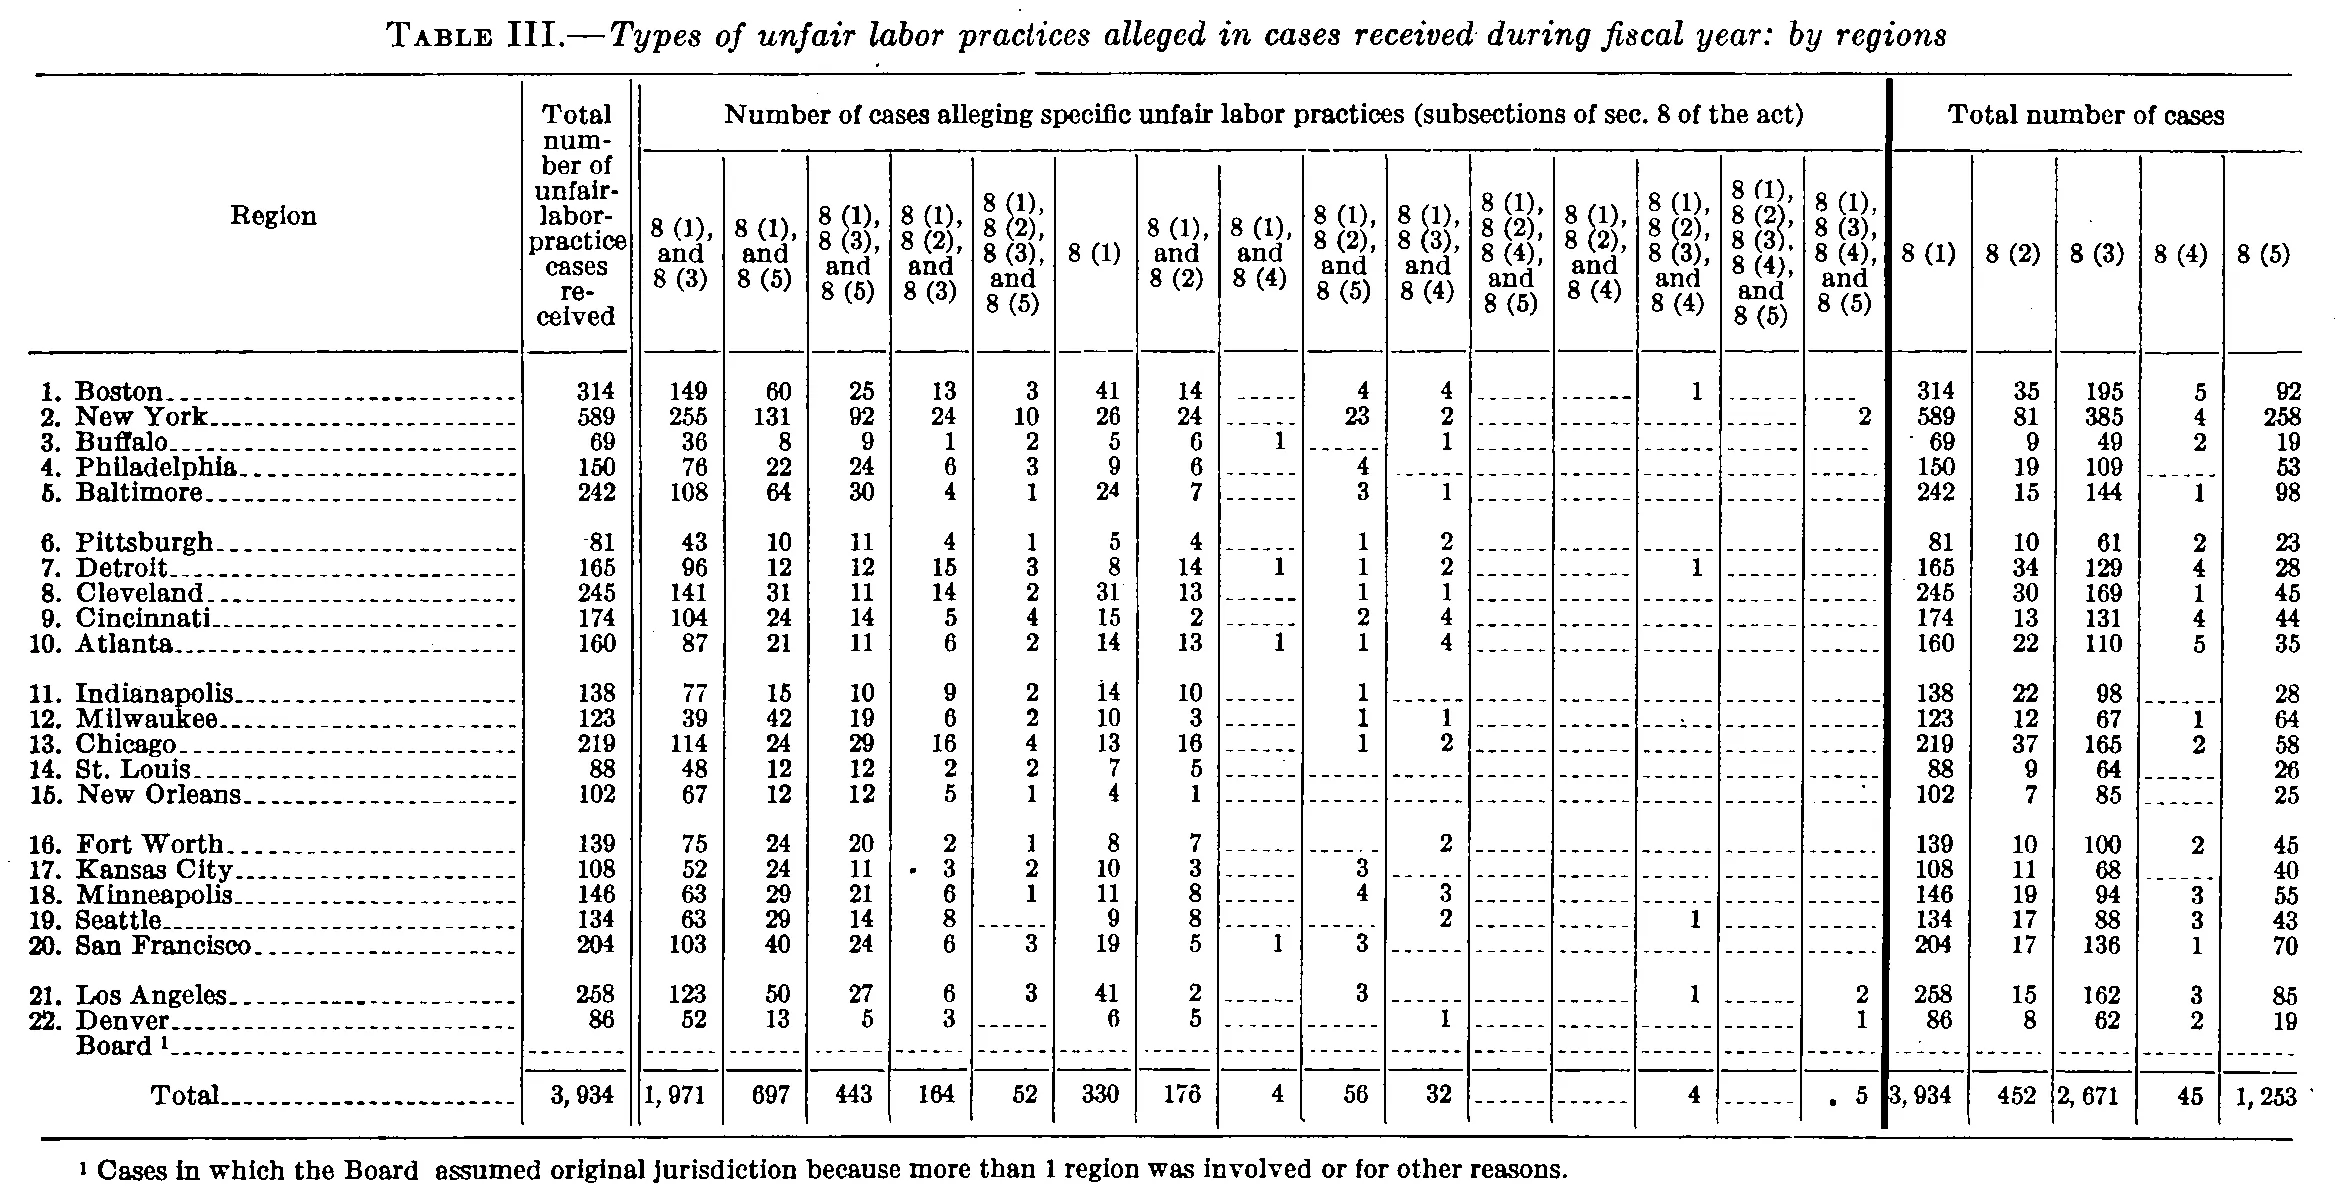
Types of unfair labor practices alleged in cases received during fiscal year: by regions
| Region | Total number of unfair-labor-practice cases received | Number of cases alleging specific unfair labor practices (subsections of sec. 8 of the act) | Total number of cases | ||||||||||||||||||
|---|---|---|---|---|---|---|---|---|---|---|---|---|---|---|---|---|---|---|---|---|---|
| Region | Total number of unfair-labor-practice cases received | 8 (1), and 8 (3) | 8 (1), and 8 (5) | 8 (1), 8 (3), and 8 (5) | 8 (1), 8 (2), and 8 (3) | 8 (1), 8 (2), 8 (3), and 8 (5) | 8 (1) | 8 (1), and 8 (2) | 8 (1), and 8 (4) | 8 (1), 8 (2), and 8 (5) | 8 (1), 8 (3), and 8 (4) | 8 (1), 8 (2), 8 (4), and 8 (5) | 8 (1), 8 (2), and 8 (4) | 8 (1), 8 (2), 8 (3), and 8 (4) | 8 (1), 8 (2), 8 (3), 8 (4), and 8 (5) | 8 (1), 8 (3), 8 (4), and 8 (5) | 8 (1) | 8 (2) | 8 (3) | 8 (4) | 8 (5) |
| 1. Boston | 314 | 149 | 60 | 25 | 13 | 3 | 41 | 14 | 4 | 4 | 1 | 314 | 35 | 195 | 5 | 92 | |||||
| 2. New York | 589 | 255 | 131 | 92 | 24 | 10 | 26 | 24 | 23 | 2 | 2 | 589 | 81 | 385 | 4 | 258 | |||||
| 3. Buffalo | 69 | 36 | 8 | 9 | 1 | 2 | 5 | 6 | 1 | 1 | 69 | 9 | 49 | 2 | 19 | ||||||
| 4. Philadelphia | 150 | 76 | 22 | 24 | 6 | 3 | 9 | 6 | 4 | 150 | 19 | 109 | 53 | ||||||||
| 5. Baltimore | 242 | 108 | 64 | 30 | 4 | 1 | 24 | 7 | 3 | 1 | 242 | 15 | 144 | 1 | 98 | ||||||
| 6. Pittsburgh | 81 | 43 | 10 | 11 | 4 | 1 | 5 | 4 | 1 | 2 | 81 | 10 | 61 | 2 | 23 | ||||||
| 7. Detroit | 165 | 96 | 12 | 12 | 15 | 3 | 8 | 14 | 1 | 1 | 2 | 1 | 165 | 34 | 129 | 4 | 28 | ||||
| 8. Cleveland | 245 | 141 | 31 | 11 | 14 | 2 | 31 | 13 | 1 | 1 | 245 | 30 | 169 | 1 | 45 | ||||||
| 9. Cincinnati | 174 | 104 | 24 | 14 | 5 | 4 | 15 | 2 | 2 | 4 | 174 | 13 | 131 | 4 | 44 | ||||||
| 10. Atlanta | 160 | 87 | 21 | 11 | 6 | 2 | 14 | 13 | 1 | 1 | 4 | 160 | 22 | 110 | 5 | 35 | |||||
| 11. Indianapolis | 138 | 77 | 15 | 10 | 9 | 2 | 14 | 10 | 1 | 138 | 22 | 98 | 28 | ||||||||
| 12. Milwaukee | 123 | 39 | 42 | 19 | 6 | 2 | 10 | 3 | 1 | 1 | 123 | 12 | 67 | 1 | 64 | ||||||
| 13. Chicago | 219 | 114 | 24 | 29 | 16 | 4 | 13 | 16 | 1 | 2 | 219 | 37 | 165 | 2 | 58 | ||||||
| 14. St. Louis | 88 | 48 | 12 | 12 | 2 | 2 | 7 | 5 | 88 | 9 | 64 | 26 | |||||||||
| 15. New Orleans | 102 | 67 | 12 | 12 | 5 | 1 | 4 | 1 | 102 | 7 | 85 | 25 | |||||||||
| 16. Fort Worth | 139 | 75 | 24 | 20 | 2 | 1 | 8 | 7 | 2 | 139 | 10 | 100 | 2 | 45 | |||||||
| 17. Kansas City | 108 | 52 | 24 | 11 | 3 | 2 | 10 | 3 | 3 | 108 | 11 | 68 | 40 | ||||||||
| 18. Minneapolis | 146 | 63 | 29 | 21 | 6 | 1 | 11 | 8 | 4 | 3 | 146 | 19 | 94 | 3 | 55 | ||||||
| 19. Seattle | 134 | 63 | 29 | 14 | 8 | 9 | 8 | 2 | 1 | 134 | 17 | 88 | 3 | 43 | |||||||
| 20. San Francisco | 204 | 103 | 40 | 24 | 6 | 3 | 19 | 5 | 1 | 3 | 204 | 17 | 136 | 1 | 70 | ||||||
| 21. Los Angeles | 258 | 123 | 50 | 27 | 6 | 3 | 41 | 2 | 3 | 1 | 2 | 258 | 15 | 162 | 3 | 85 | |||||
| 22. Denver | 86 | 52 | 13 | 5 | 3 | 6 | 5 | 1 | 1 | 86 | 8 | 62 | 2 | 19 | |||||||
| Board | |||||||||||||||||||||
| Total | 3,934 | 1,971 | 697 | 443 | 164 | 52 | 330 | 176 | 4 | 56 | 32 | 4 | 5 | 3,934 | 452 | 2,671 | 45 | 1,253 | |||
- 1 Cases in which the Board assumed original jurisdiction because more than 1 region was involved or for other reasons.
339 of 339 figures sit in a row or column sum that works out. 4 cells break a sum: '2. New York', column 2: prints 589, columns 3 to 15 add to 587; '21. Los Angeles', column 2: prints 258, columns 3 to 15 add to 256; '22. Denver', column 2: prints 86, columns 3 to 15 add to 85; 'Total', column 2: prints 3,934, columns 3 to 15 add to 3,929.
Reader’s notes
p. 29. 22 columns: stub, "Total number of unfair-labor-practice cases received", 15 subsection-combination columns, and 5 "Total number of cases" columns. A heavy vertical rule separates the 15 combination columns from the 5 total columns. Verification: every one of the 21 numeric columns sums down the 22 regions to exactly the printed figure in the Total row, which confirms the column placement of each value, including the sparse single-digit entries in the right-hand combination columns. Stray ink treated as printing artifacts, not as digits or markers: a small dot precedes "81" in the Pittsburgh stub-total column, "3" in the Kansas City "8 (1), 8 (2), and 8 (3)" column, and "5" in the Total row's "8 (1), 8 (3), 8 (4), and 8 (5)" column. Each is transcribed as the bare number; column sums support these readings (Kansas City's 3 is needed for the column total of 164, and the Total-row 5 equals New York 2 + Los Angeles 2 + Denver 1). The "Board" row carries footnote marker 1 and holds only dash rules across all columns, so every value cell is empty. The Seattle and Denver rows print a dash rule rather than a figure in the "8 (1), 8 (2), 8 (3), and 8 (5)" column; both are empty cells. Two combination headings are easy to confuse because they differ only in which subsections appear: column 13 is "8 (1), 8 (2), and 8 (4)" (empty for every region) and column 14 is "8 (1), 8 (2), 8 (3), and 8 (4)" (entries of 1 for Boston, Detroit, Seattle, Los Angeles). I read them in that left-to-right order from the printed heading stacks.
Source image
Source data: U.S. NLRB Annual Reports (public domain). Reconstruction by NLRB Stats Archive. Read by claude-opus-5 (effort max, prompt extract_v1) from the 300-dpi scan; stitched by page. Updated October 2026.