NLRB Stats Archive › Annual Reports › FY1940 › Types of unfair labor practices alleged in cases pending, June 30, 1939: by regions
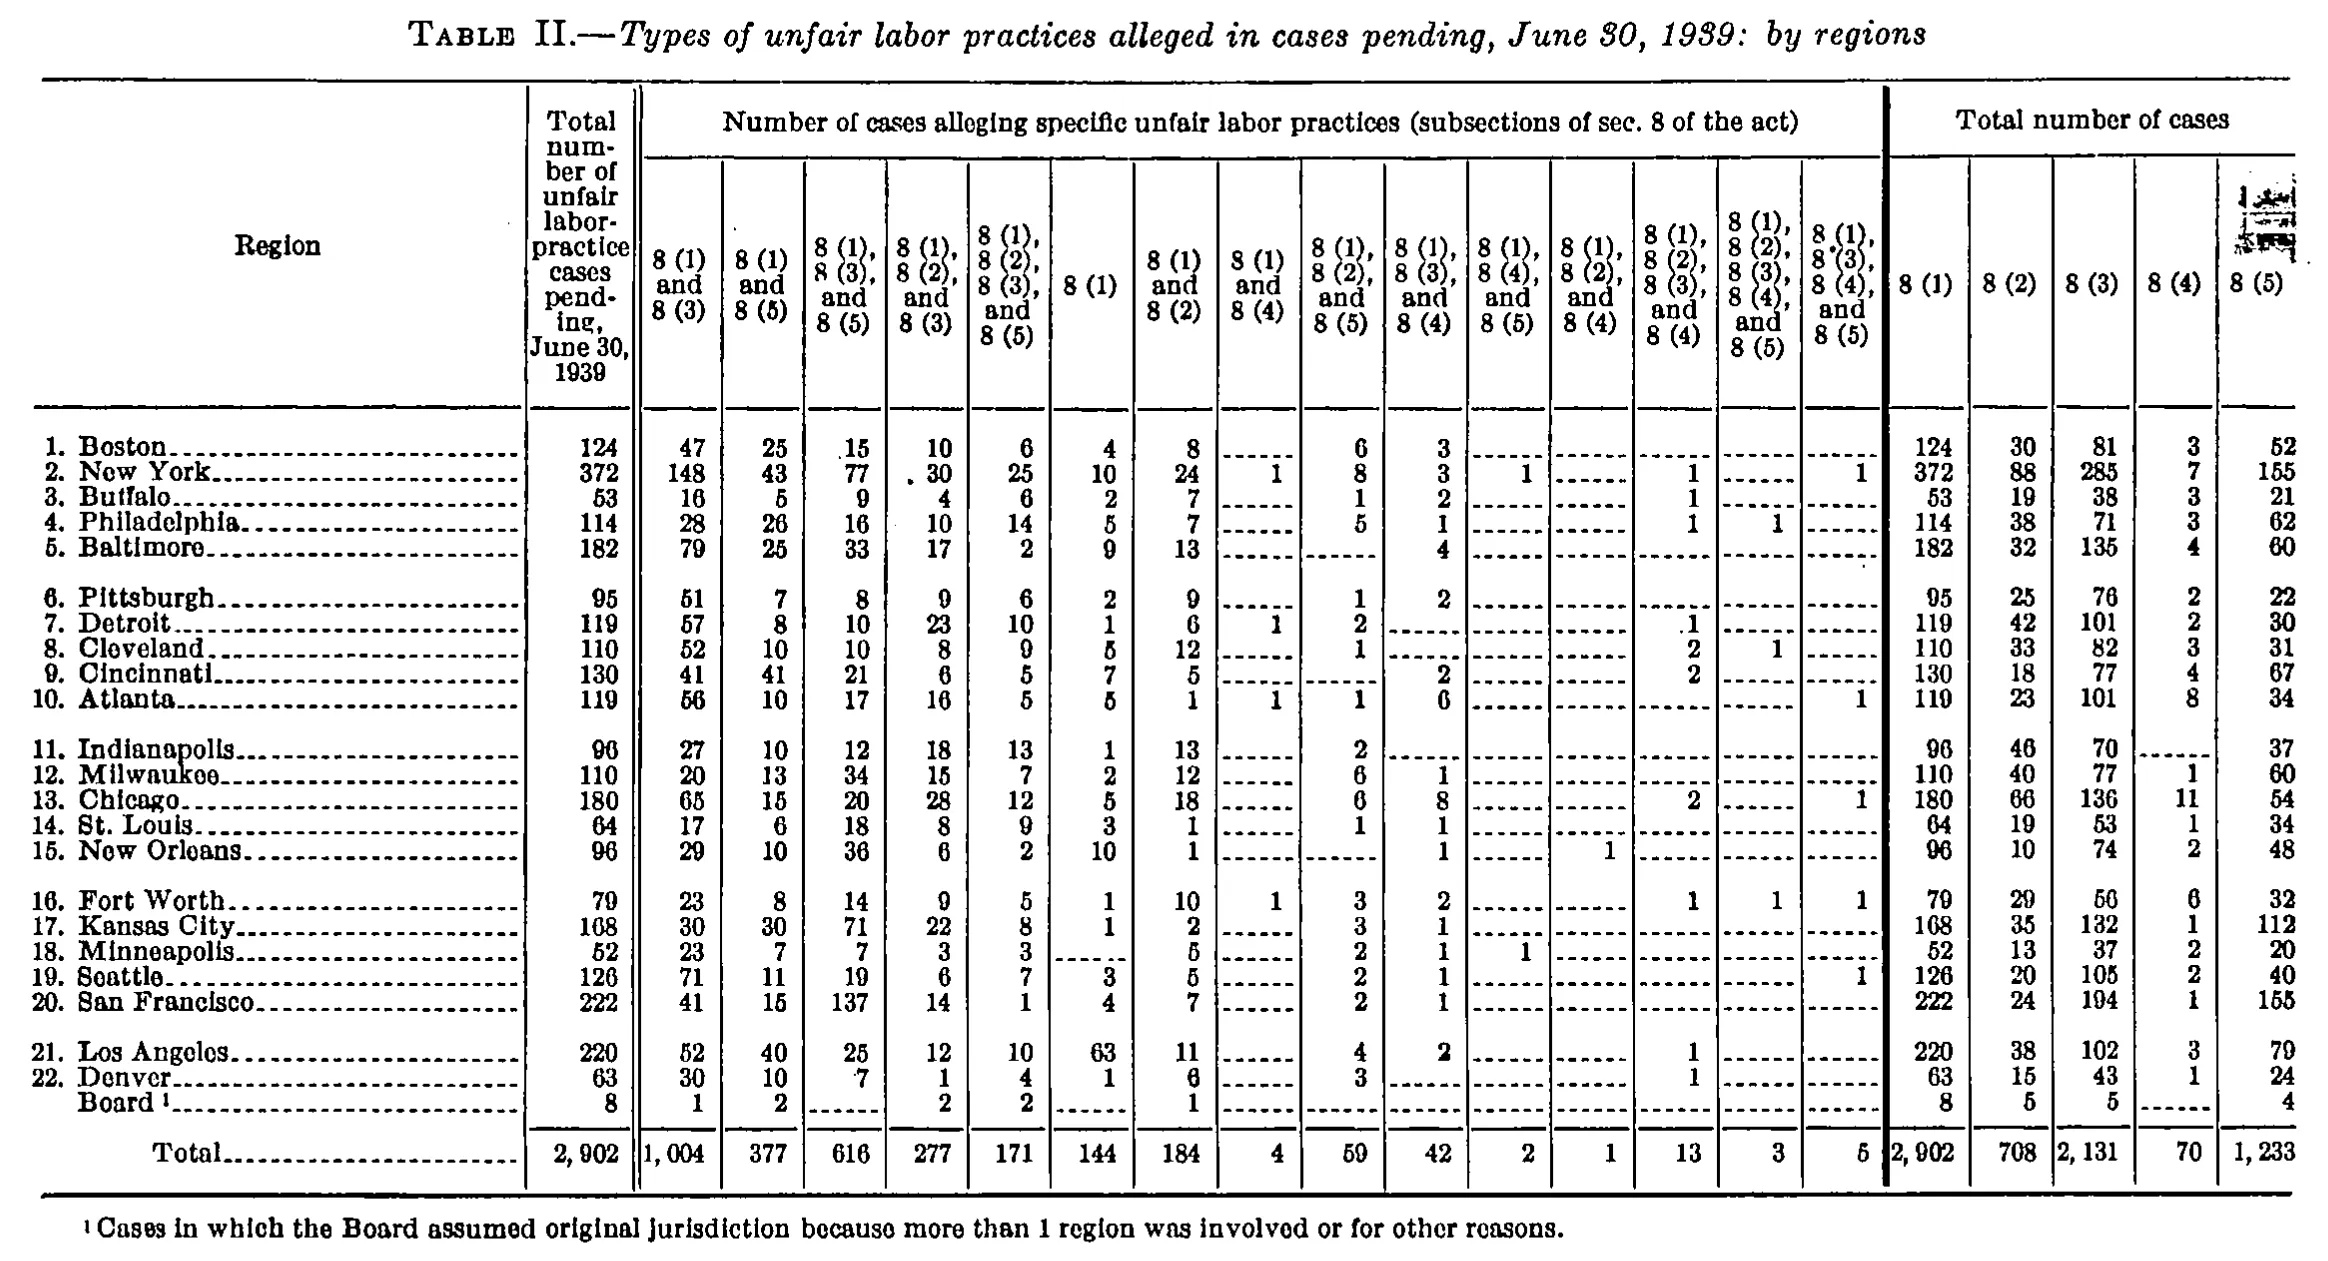
Types of unfair labor practices alleged in cases pending, June 30, 1939: by regions
| Region | Total number of unfair labor-practice cases pending, June 30, 1939 | Number of cases alleging specific unfair labor practices (subsections of sec. 8 of the act) | Total number of cases | ||||||||||||||||||
|---|---|---|---|---|---|---|---|---|---|---|---|---|---|---|---|---|---|---|---|---|---|
| Region | Total number of unfair labor-practice cases pending, June 30, 1939 | 8 (1) and 8 (3) | 8 (1) and 8 (5) | 8 (1), 8 (3), and 8 (5) | 8 (1), 8 (2), and 8 (3) | 8 (1), 8 (2), 8 (3), and 8 (5) | 8 (1) | 8 (1) and 8 (2) | 8 (1) and 8 (4) | 8 (1), 8 (2), and 8 (5) | 8 (1), 8 (3), and 8 (4) | 8 (1), 8 (4), and 8 (5) | 8 (1), 8 (2), and 8 (4) | 8 (1), 8 (2), 8 (3), and 8 (4) | 8 (1), 8 (2), 8 (3), 8 (4), and 8 (5) | 8 (1), 8 (3), 8 (4), and 8 (5) | 8 (1) | 8 (2) | 8 (3) | 8 (4) | 8 (5) |
| 1. Boston | 124 | 47 | 25 | 15 | 10 | 6 | 4 | 8 | 6 | 3 | 124 | 30 | 81 | 3 | 52 | ||||||
| 2. New York | 372 | 148 | 43 | 77 | 30 | 25 | 10 | 24 | 1 | 8 | 3 | 1 | 1 | 1 | 372 | 88 | 285 | 7 | 155 | ||
| 3. Buffalo | 53 | 16 | 5 | 9 | 4 | 6 | 2 | 7 | 1 | 2 | 1 | 53 | 19 | 38 | 3 | 21 | |||||
| 4. Philadelphia | 114 | 28 | 26 | 16 | 10 | 14 | 5 | 7 | 5 | 1 | 1 | 1 | 114 | 38 | 71 | 3 | 62 | ||||
| 5. Baltimore | 182 | 79 | 25 | 33 | 17 | 2 | 9 | 13 | 4 | 182 | 32 | 135 | 4 | 60 | |||||||
| 6. Pittsburgh | 95 | 51 | 7 | 8 | 9 | 6 | 2 | 9 | 1 | 2 | 95 | 25 | 76 | 2 | 22 | ||||||
| 7. Detroit | 119 | 57 | 8 | 10 | 23 | 10 | 1 | 6 | 1 | 2 | 1 | 119 | 42 | 101 | 2 | 30 | |||||
| 8. Cleveland | 110 | 52 | 10 | 10 | 8 | 9 | 5 | 12 | 1 | 2 | 1 | 110 | 33 | 82 | 3 | 31 | |||||
| 9. Cincinnati | 130 | 41 | 41 | 21 | 6 | 5 | 7 | 5 | 2 | 2 | 130 | 18 | 77 | 4 | 67 | ||||||
| 10. Atlanta | 119 | 56 | 10 | 17 | 16 | 5 | 5 | 1 | 1 | 1 | 6 | 1 | 119 | 23 | 101 | 8 | 34 | ||||
| 11. Indianapolis | 96 | 27 | 10 | 12 | 18 | 13 | 1 | 13 | 2 | 96 | 46 | 70 | 37 | ||||||||
| 12. Milwaukee | 110 | 20 | 13 | 34 | 15 | 7 | 2 | 12 | 6 | 1 | 110 | 40 | 77 | 1 | 60 | ||||||
| 13. Chicago | 180 | 65 | 15 | 20 | 28 | 12 | 5 | 18 | 6 | 8 | 2 | 1 | 180 | 66 | 136 | 11 | 54 | ||||
| 14. St. Louis | 64 | 17 | 6 | 18 | 8 | 9 | 3 | 1 | 1 | 1 | 64 | 19 | 53 | 1 | 34 | ||||||
| 15. New Orleans | 96 | 29 | 10 | 36 | 6 | 2 | 10 | 1 | 1 | 1 | 96 | 10 | 74 | 2 | 48 | ||||||
| 16. Fort Worth | 79 | 23 | 8 | 14 | 9 | 5 | 1 | 10 | 1 | 3 | 2 | 1 | 1 | 1 | 79 | 29 | 56 | 6 | 32 | ||
| 17. Kansas City | 168 | 30 | 30 | 71 | 22 | 8 | 1 | 2 | 3 | 1 | 168 | 35 | 132 | 1 | 112 | ||||||
| 18. Minneapolis | 52 | 23 | 7 | 7 | 3 | 3 | 5 | 2 | 1 | 1 | 52 | 13 | 37 | 2 | 20 | ||||||
| 19. Seattle | 126 | 71 | 11 | 19 | 6 | 7 | 3 | 5 | 2 | 1 | 1 | 126 | 20 | 105 | 2 | 40 | |||||
| 20. San Francisco | 222 | 41 | 15 | 137 | 14 | 1 | 4 | 7 | 2 | 1 | 222 | 24 | 194 | 1 | 155 | ||||||
| 21. Los Angeles | 220 | 52 | 40 | 25 | 12 | 10 | 63 | 11 | 4 | 2 | 1 | 220 | 38 | 102 | 3 | 79 | |||||
| 22. Denver | 63 | 30 | 10 | 7 | 1 | 4 | 1 | 6 | 3 | 1 | 63 | 15 | 43 | 1 | 24 | ||||||
| Board | 8 | 1 | 2 | 2 | 2 | 1 | 8 | 5 | 5 | 4 | |||||||||||
| Total | 2,902 | 1,004 | 377 | 616 | 277 | 171 | 144 | 184 | 4 | 59 | 42 | 2 | 1 | 13 | 3 | 5 | 2,902 | 708 | 2,131 | 70 | 1,233 |
- 1 Cases in which the Board assumed original jurisdiction because more than 1 region was involved or for other reasons.
377 of 377 figures sit in a row or column sum that works out.
Reader’s notes
p. 28. 22 columns: stub, the single "Total number of unfair labor-practice cases pending, June 30, 1939" column, 15 columns under "Number of cases alleging specific unfair labor practices (subsections of sec. 8 of the act)", and 5 columns under "Total number of cases". The 15 specific-practice columns are heavily sparse, with most empty cells printed as dash rules; all of these are transcribed as "". The whole grid was cross-checked arithmetically and is internally consistent: every region's 15 specific-practice cells sum to its printed total; each of the five "Total number of cases" figures equals the sum of the specific-practice columns that contain that subsection; and all 21 numeric columns foot exactly to the printed Total line (e.g. 8 (1) and 8 (3) = 1,004; 8 (2) total = 708; 8 (3) total = 2,131; 8 (4) total = 70; 8 (5) total = 1,233; the Total column = 2,902). No printed figure appears to be in error. Doubtful glyphs, all resolved by those checks: "17. Kansas City", Total column and 8 (1) column — the middle digit is broken and could be read as 0, giving "108"; it is 168 (the Total column foots to 2,902 only with 168, and 30+30+71+22+8+1+2+3+1 = 168). "8. Cleveland", column "8 (1)" — the degraded glyph reads 5 (confirmed by the row sum of 110). "16. Fort Worth", "Total number of cases" columns 8 (3) and 8 (4) — printed faintly as 56 and 6 (not 50 and 0); both confirmed by the column totals. Because several lone 1s and 2s sit in the narrow sparse columns where visual alignment is tight, the exact column of each was fixed by the row and column sums; notable cases: "9. Cincinnati" has 2 under "8 (1), 8 (3), and 8 (4)" and 2 under "8 (1), 8 (2), 8 (3), and 8 (4)" (its 8 (5) total of 67 leaves no room for a value under any 8 (5) combination); "15. New Orleans" has 1 under "8 (1), 8 (3), and 8 (4)" and 1 under "8 (1), 8 (2), and 8 (4)". The top right corner of the header box, above "8 (5)" in the "Total number of cases" block, carries a dark scan artifact (an ink smudge or stray handwritten mark) overlaying the blank heading space; it is not printed table text and is not transcribed.
Source image
Source data: U.S. NLRB Annual Reports (public domain). Reconstruction by NLRB Stats Archive. Read by claude-opus-5 (effort max, prompt extract_v1) from the 300-dpi scan; stitched by page. Updated October 2026.