NLRB Stats Archive › Annual Reports › FY1939 › Comparison of number of workers involved in cases brought before the National Labor Relations Board and number of workers involved in strikes beginning in each month, for all causes, and for organization, October 1935-June 1939
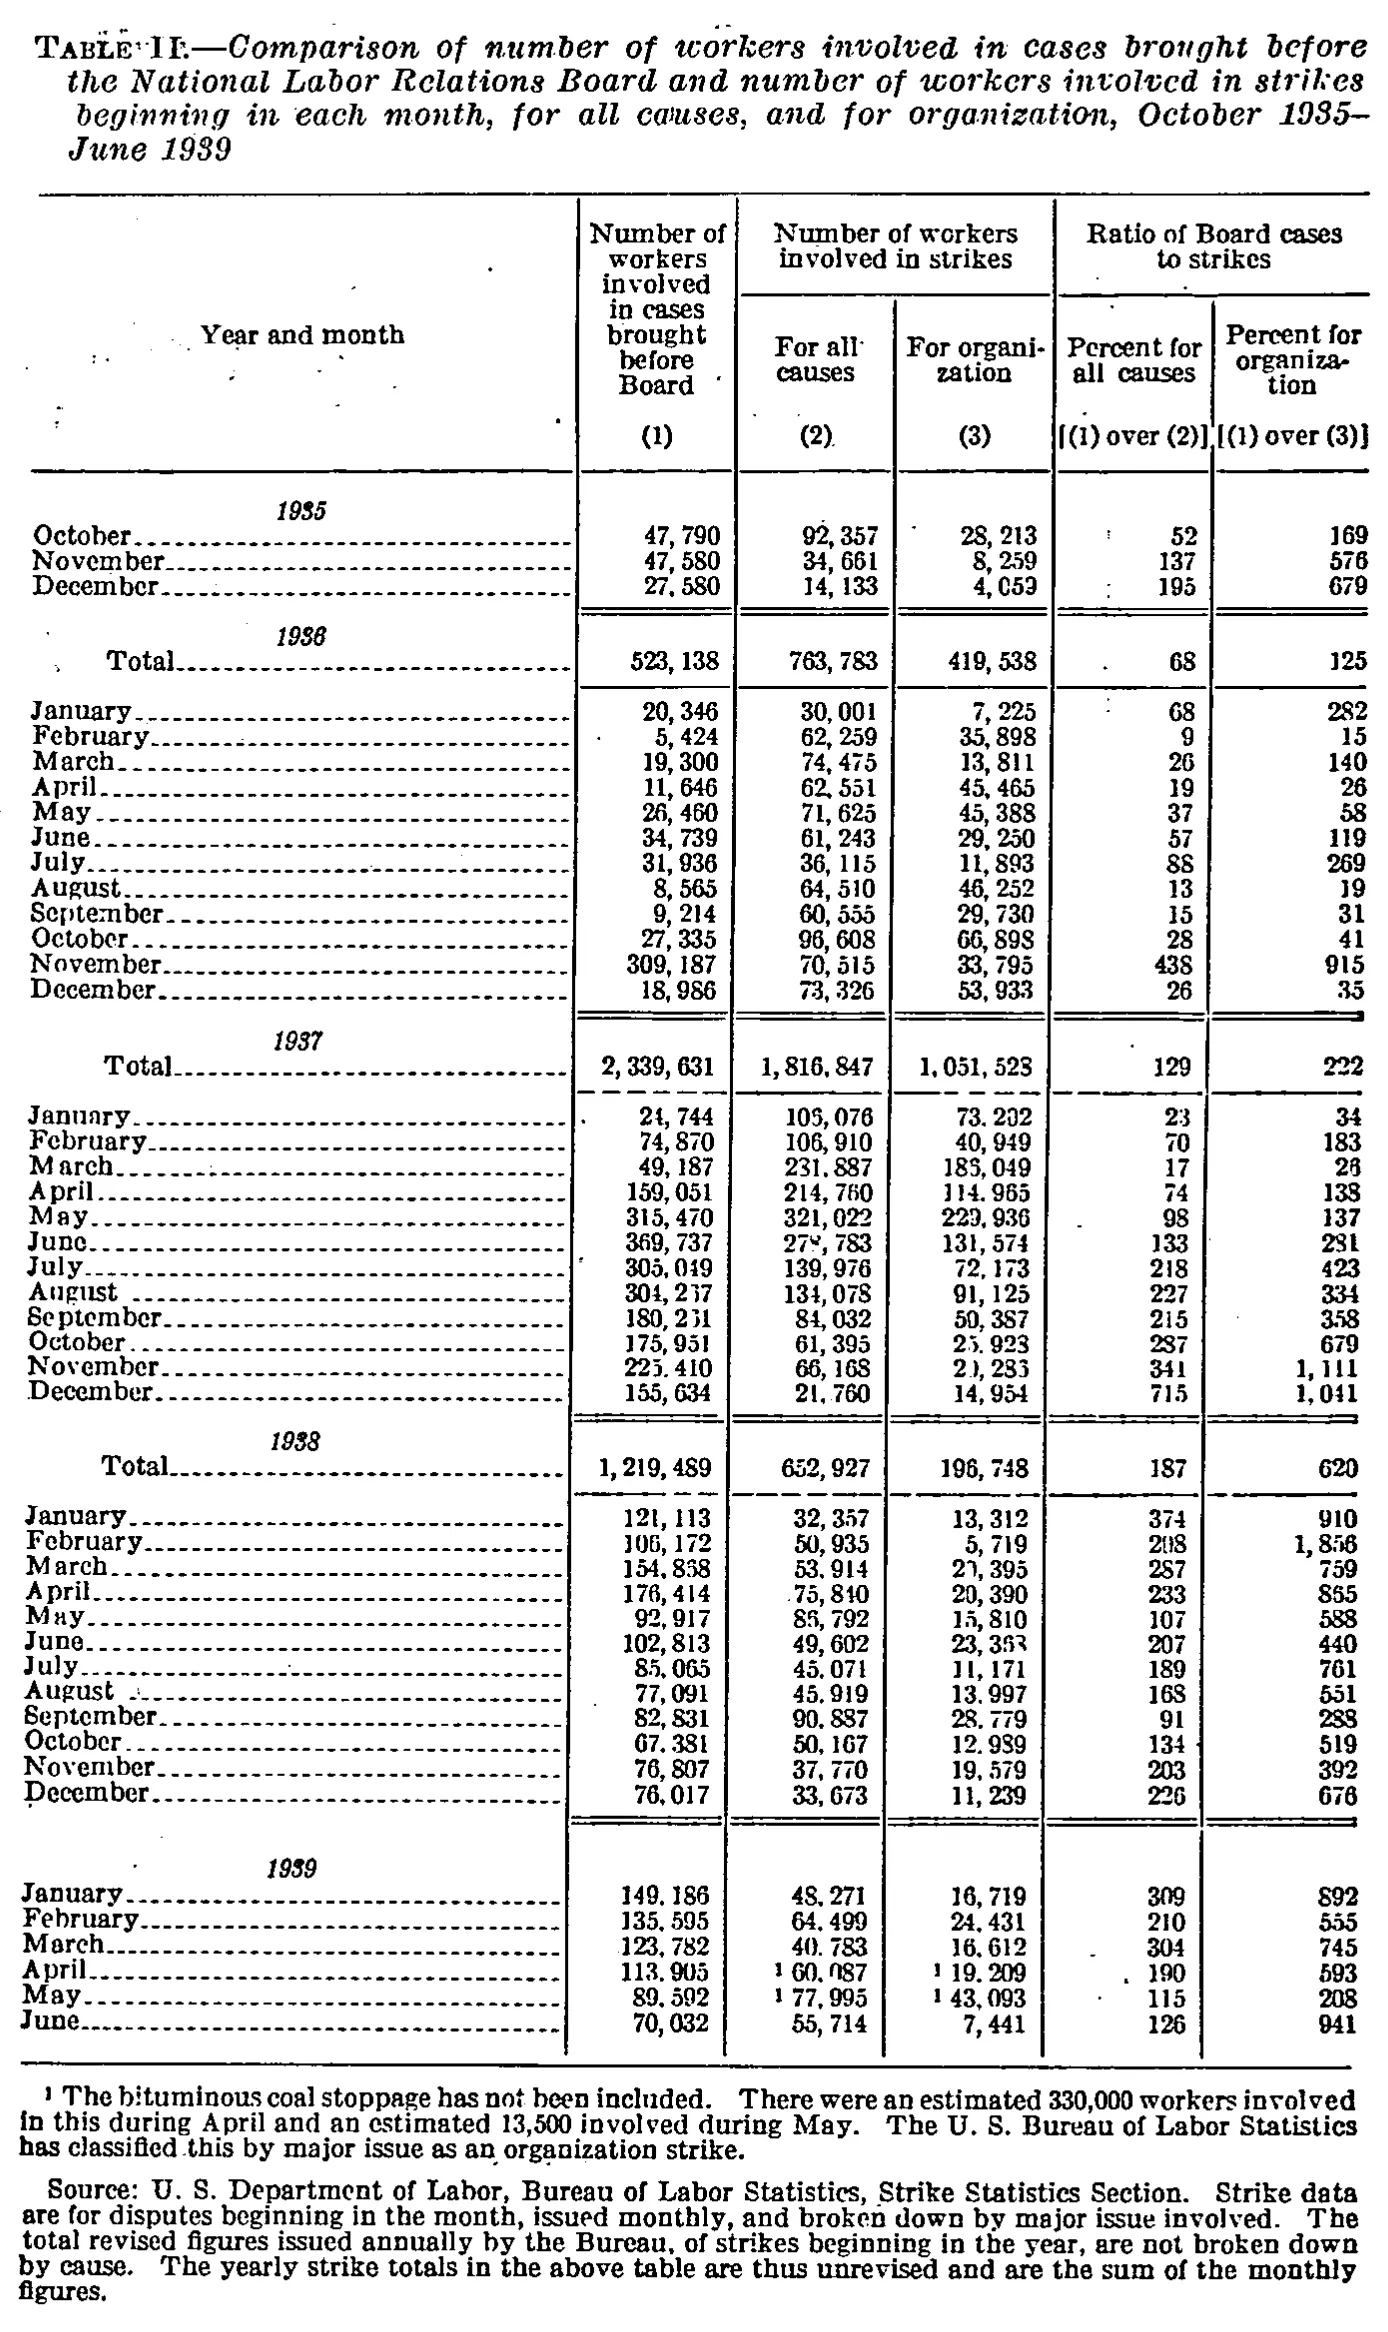
Comparison of number of workers involved in cases brought before the National Labor Relations Board and number of workers involved in strikes beginning in each month, for all causes, and for organization, October 1935-June 1939
| Year and month | Number of workers involved in cases brought before Board | Number of workers involved in strikes | Ratio of Board cases to strikes | ||
|---|---|---|---|---|---|
| Year and month | Number of workers involved in cases brought before Board | For all causes | For organization | Percent for all causes | Percent for organization |
| Year and month | [1] | [2] | [3] | [(1) over (2)] | [(1) over (3)] |
| 1935 | |||||
| October | 47,790 | 92,357 | 28,213 | 52 | 169 |
| November | 47,580 | 34,661 | 8,259 | 137 | 576 |
| December | 27,580 | 14,133 | 4,059 | 195 | 679 |
| 1936 | |||||
| Total | 523,138 | 763,783 | 419,538 | 68 | 125 |
| January | 20,346 | 30,001 | 7,225 | 68 | 282 |
| February | 5,424 | 62,259 | 35,898 | 9 | 15 |
| March | 19,300 | 74,475 | 13,811 | 26 | 140 |
| April | 11,646 | 62,551 | 45,465 | 19 | 26 |
| May | 26,460 | 71,625 | 45,388 | 37 | 58 |
| June | 34,739 | 61,243 | 29,250 | 57 | 119 |
| July | 31,936 | 36,115 | 11,893 | 88 | 269 |
| August | 8,565 | 64,510 | 46,252 | 13 | 19 |
| September | 9,214 | 60,555 | 29,730 | 15 | 31 |
| October | 27,335 | 96,608 | 66,898 | 28 | 41 |
| November | 309,187 | 70,515 | 33,795 | 438 | 915 |
| December | 18,986 | 73,326 | 53,933 | 26 | 35 |
| 1937 | |||||
| Total | 2,339,631 | 1,816,847 | 1,051,523 | 129 | 222 |
| January | 24,744 | 106,076 | 73,292 | 23 | 34 |
| February | 74,870 | 106,910 | 40,949 | 70 | 183 |
| March | 49,187 | 281,887 | 185,049 | 17 | 26 |
| April | 159,051 | 214,760 | 114,965 | 74 | 138 |
| May | 315,470 | 321,022 | 229,936 | 98 | 137 |
| June | 369,737 | 278,783 | 131,574 | 133 | 281 |
| July | 305,049 | 139,976 | 72,173 | 218 | 423 |
| August | 304,237 | 134,078 | 91,125 | 227 | 334 |
| September | 180,291 | 84,032 | 50,387 | 215 | 358 |
| October | 175,951 | 61,395 | 25,923 | 287 | 679 |
| November | 225,410 | 66,168 | 20,283 | 341 | 1,111 |
| December | 155,634 | 21,760 | 14,954 | 715 | 1,041 |
| 1938 | |||||
| Total | 1,219,489 | 652,927 | 196,748 | 187 | 620 |
| January | 121,113 | 32,357 | 13,312 | 374 | 910 |
| February | 106,172 | 50,935 | 5,719 | 208 | 1,856 |
| March | 154,868 | 53,914 | 20,395 | 287 | 759 |
| April | 176,414 | 75,840 | 20,390 | 233 | 865 |
| May | 92,917 | 86,792 | 15,810 | 107 | 588 |
| June | 102,813 | 49,602 | 23,353 | 207 | 440 |
| July | 85,065 | 45,071 | 11,171 | 189 | 761 |
| August | 77,091 | 45,919 | 13,997 | 168 | 551 |
| September | 82,831 | 90,887 | 28,779 | 91 | 288 |
| October | 67,381 | 50,167 | 12,939 | 134 | 519 |
| November | 76,807 | 37,770 | 19,579 | 203 | 392 |
| December | 76,017 | 33,673 | 11,239 | 226 | 676 |
| 1939 | |||||
| January | 149,186 | 48,271 | 16,719 | 309 | 892 |
| February | 135,595 | 64,499 | 24,431 | 210 | 555 |
| March | 123,782 | 40,783 | 16,612 | 304 | 745 |
| April | 113,905 | 60,087 | 19,209 | 190 | 593 |
| May | 89,592 | 77,995 | 43,093 | 115 | 208 |
| June | 70,032 | 55,714 | 7,441 | 126 | 941 |
- 1 The bituminous coal stoppage has not been included. There were an estimated 330,000 workers involved in this during April and an estimated 13,500 involved during May. The U. S. Bureau of Labor Statistics has classified this by major issue as an organization strike.
- Source: U. S. Department of Labor, Bureau of Labor Statistics, Strike Statistics Section. Strike data are for disputes beginning in the month, issued monthly, and broken down by major issue involved. The total revised figures issued annually by the Bureau, of strikes beginning in the year, are not broken down by cause. The yearly strike totals in the above table are thus unrevised and are the sum of the monthly figures.
39 of 144 figures sit in a row or column sum that works out.
Reader’s notes
p. 200. Layout: each year heading is a label-only section line, and within 1936, 1937 and 1938 the "Total" line is printed immediately under the year heading, i.e. before that year's twelve monthly rows (the totals do equal the sums of the months that follow them). 1935 (3 months) and 1939 (6 months) carry no Total line, as printed. Doubtful cells, all in the 1937 block, where the scan is degraded and 3/8/9 are hard to separate; in each case I chose the reading that reconciles with the printed column total and/or the printed ratio: - March 1937, "For all causes": read 281,887. The hundred-thousands digit could be taken for a 3 (231,887), but only 281,887 makes the column add to the printed 1,816,847 and makes the printed 17 percent correct. - June 1937, "For all causes": read 278,783 for the same two reasons (the column then sums exactly to 1,816,847). - June 1937, "Percent for organization": read 281; the middle digit could be read as 3, but 369,737/131,574 = 281. - August 1937 and September 1937, column (1): read 304,237 and 180,291. The pair could also be 304,297 and 180,231 (either pair gives the printed total 2,339,631); I chose 180,291 because 180,231/84,032 is 214.5, while the printed percent is 215. Column totals that do not reconcile with my reading: - 1937 "For organization": my cells sum to 1,051,610 against the printed 1,051,523 (87 high), so one cell in that column is misread. The two likeliest are January 73,292 (the thousands separator prints as a dot) and March 185,049, which also implies 26.6 percent where 26 is printed. - 1938 "For organization": my cells sum to 196,683 against the printed 196,748 (65 low). October 1938 is the most suspect cell: 12,939 implies 521 percent where 519 is printed (519 would need about 12,983). Footnote markers: the raised 1 is printed to the left of the April and May 1939 figures in columns (2) and (3); per the convention it is written after the value. Nothing is cut off by the crop.
Source image
Source data: U.S. NLRB Annual Reports (public domain). Reconstruction by NLRB Stats Archive. Read by claude-opus-5 (effort max, prompt extract_v1) from the 300-dpi scan; stitched by page. Updated October 2026.