NLRB Stats Archive › Annual Reports › FY1939 › Comparison of number of cases brought before the National Labor Relations Board and number of strikes, beginning in each month for all causes, and for organization, October 1935-June 1939
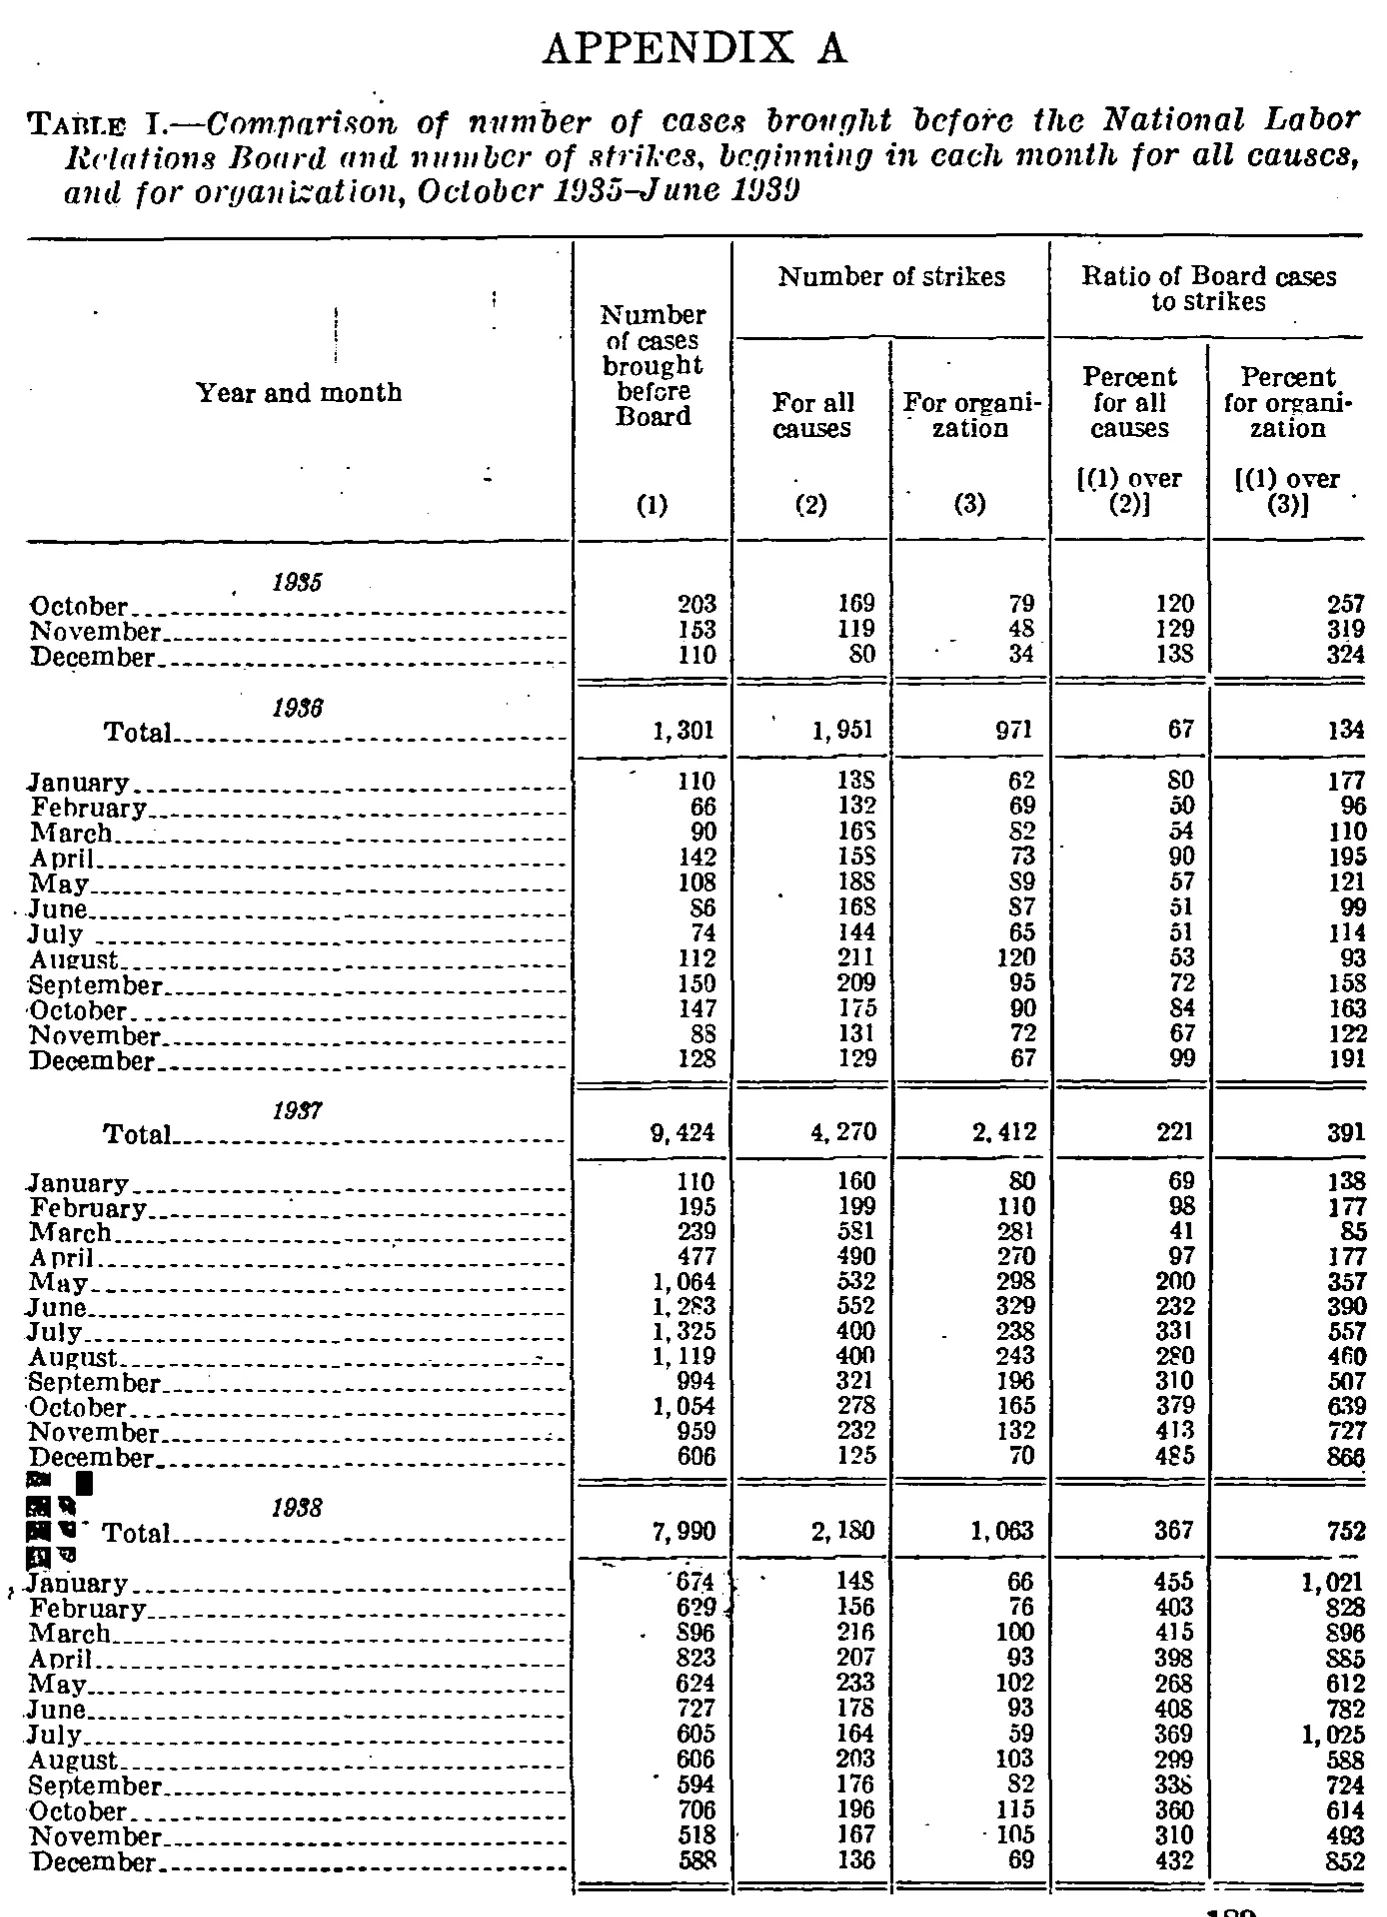
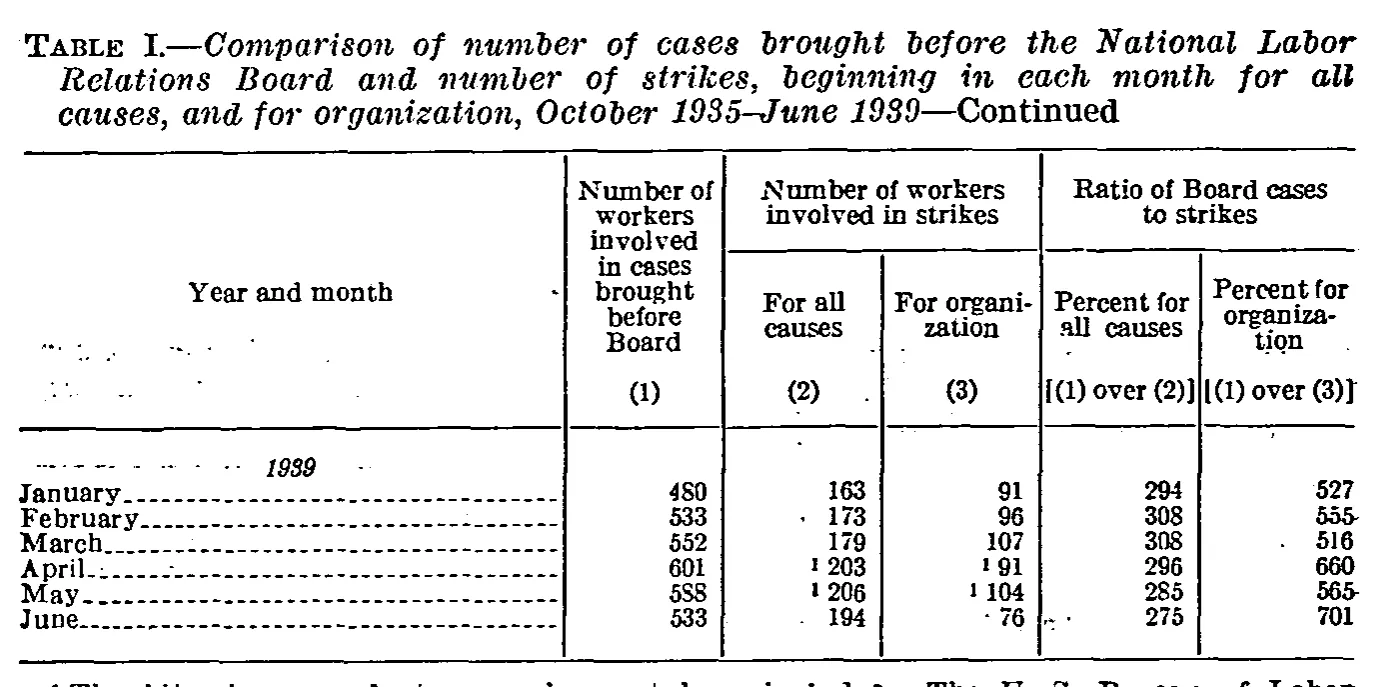
Comparison of number of cases brought before the National Labor Relations Board and number of strikes, beginning in each month for all causes, and for organization, October 1935-June 1939
Stitched from pp. 196–197.
| Year and month | Number of cases brought before Board | Number of strikes | Ratio of Board cases to strikes | ||
|---|---|---|---|---|---|
| Year and month | Number of cases brought before Board | For all causes | For organization | Percent for all causes | Percent for organization |
| Year and month | [1] | [2] | [3] | [(1) over (2)] | [(1) over (3)] |
| 1935 | |||||
| October | 203 | 169 | 79 | 120 | 257 |
| November | 153 | 119 | 48 | 129 | 319 |
| December | 110 | 80 | 34 | 138 | 324 |
| 1936 | |||||
| Total | 1,301 | 1,951 | 971 | 67 | 134 |
| January | 110 | 138 | 62 | 80 | 177 |
| February | 66 | 132 | 69 | 50 | 96 |
| March | 90 | 168 | 82 | 54 | 110 |
| April | 142 | 158 | 73 | 90 | 195 |
| May | 108 | 188 | 89 | 57 | 121 |
| June | 86 | 168 | 87 | 51 | 99 |
| July | 74 | 144 | 65 | 51 | 114 |
| August | 112 | 211 | 120 | 53 | 93 |
| September | 150 | 209 | 95 | 72 | 158 |
| October | 147 | 175 | 90 | 84 | 163 |
| November | 88 | 131 | 72 | 67 | 122 |
| December | 128 | 129 | 67 | 99 | 191 |
| 1937 | |||||
| Total | 9,424 | 4,270 | 2,412 | 221 | 391 |
| January | 110 | 160 | 80 | 69 | 138 |
| February | 195 | 199 | 110 | 98 | 177 |
| March | 239 | 581 | 281 | 41 | 85 |
| April | 477 | 490 | 270 | 97 | 177 |
| May | 1,064 | 532 | 298 | 200 | 357 |
| June | 1,283 | 552 | 329 | 232 | 390 |
| July | 1,325 | 400 | 238 | 331 | 557 |
| August | 1,119 | 400 | 243 | 280 | 460 |
| September | 994 | 321 | 196 | 310 | 507 |
| October | 1,054 | 278 | 165 | 379 | 639 |
| November | 959 | 232 | 132 | 413 | 727 |
| December | 606 | 125 | 70 | 485 | 866 |
| 1938 | |||||
| Total | 7,990 | 2,180 | 1,063 | 367 | 752 |
| January | 674 | 148 | 66 | 455 | 1,021 |
| February | 629 | 156 | 76 | 403 | 828 |
| March | 896 | 216 | 100 | 415 | 896 |
| April | 823 | 207 | 93 | 398 | 885 |
| May | 624 | 233 | 102 | 268 | 612 |
| June | 727 | 178 | 93 | 408 | 782 |
| July | 605 | 164 | 59 | 369 | 1,025 |
| August | 606 | 203 | 103 | 299 | 588 |
| September | 594 | 176 | 82 | 338 | 724 |
| October | 706 | 196 | 115 | 360 | 614 |
| November | 518 | 167 | 105 | 310 | 493 |
| December | 588 | 136 | 69 | 432 | 852 |
| 1939 | |||||
| January | 480 | 163 | 91 | 294 | 527 |
| February | 533 | 173 | 96 | 308 | 555 |
| March | 552 | 179 | 107 | 308 | 516 |
| April | 601 | 203 | 91 | 296 | 660 |
| May | 588 | 206 | 104 | 285 | 565 |
| June | 533 | 194 | 76 | 275 | 701 |
78 of 144 figures sit in a row or column sum that works out.
Reader’s notes
p. 196. Layout: each italic year line (1935, 1936, 1937, 1938) is a section label with no values; for 1936-1938 the "Total" row is printed directly under the year line and precedes that year's twelve monthly rows (verified: the monthly figures sum to the Total printed above them). 1935 has no Total row because only October-December are shown. Suspected misprint: the 1937 "Total" in column (1) is printed 9,424, but the twelve 1937 monthly values in that column sum to 9,425. The individual monthly values are confirmed by the printed percentage columns (e.g. 1,325/400 = 331, 606/70 = 866), and the 1937 totals in columns (2) and (3) match their month sums exactly, so the discrepancy appears to be in the printed total. Transcribed as printed. All other totals and all computed ratios reconcile. Scan quality: this is a 1-bit scan in which the digit 8 frequently renders like a capital S; readings of 8 were confirmed against the ratio columns wherever possible. The December 1937 "Percent for organization" cell (866) and the August 1937 value (460) are slightly soft but consistent with the arithmetic. There is a cluster of dark ink blobs / stray marks in the left margin beside the 1937 December-1938 Total area; they are scanning or stamp artifacts, not table content. Crop coverage: the caption covers October 1935-June 1939, but this page ends at December 1938; the January-June 1939 rows and any closing rule, source note or footnotes continue on the following page. The printed page number at the bottom right is clipped by the crop.
p. 197. This is a continuation page: the caption carries "—Continued" and the body resumes with the italic year line "1939". Only the January–June 1939 block is on this crop; earlier months are on the preceding page. Footnote 1 (the marker appears before the April and May values in columns (2) and (3)) is printed below the table but is sliced off by the bottom edge of the crop — only the upper halves of the letters survive (it begins "1 The ..." and ends with something like "The U. S. Bureau of Labor"). Because it cannot be read reliably, `footnotes` is left empty rather than guessed. The superscript 1 markers sit to the LEFT of the four values (printed "¹ 203", "¹ 91", "¹ 206", "¹ 104"); following the convention requested, they are written after the number behind a caret. Scan artifacts: the "8" glyphs are degraded and read like "S" in several places — "480" (January, col 1) prints as "4S0" and "588" (May, col 1) prints as "5S8"; both are read as 8 on the basis of digit shape and column context. Stray ink/dots appear in the blank area of the stub under "Year and month" and beside a few values (e.g. a dot before February's 173 and before June's 194, and specks left of June's 76 and in the Percent-for-all-causes column at June); these are treated as noise, not characters. No totals are printed on this crop, so nothing could be cross-checked arithmetically.
Source image
Source data: U.S. NLRB Annual Reports (public domain). Reconstruction by NLRB Stats Archive. Read by claude-opus-5 (effort max, prompt extract_v1) from the 300-dpi scan; stitched by page. Updated October 2026.