NLRB Stats Archive › Annual Reports › FY1939 › Cases brought before the NLRB compared with number of strikes
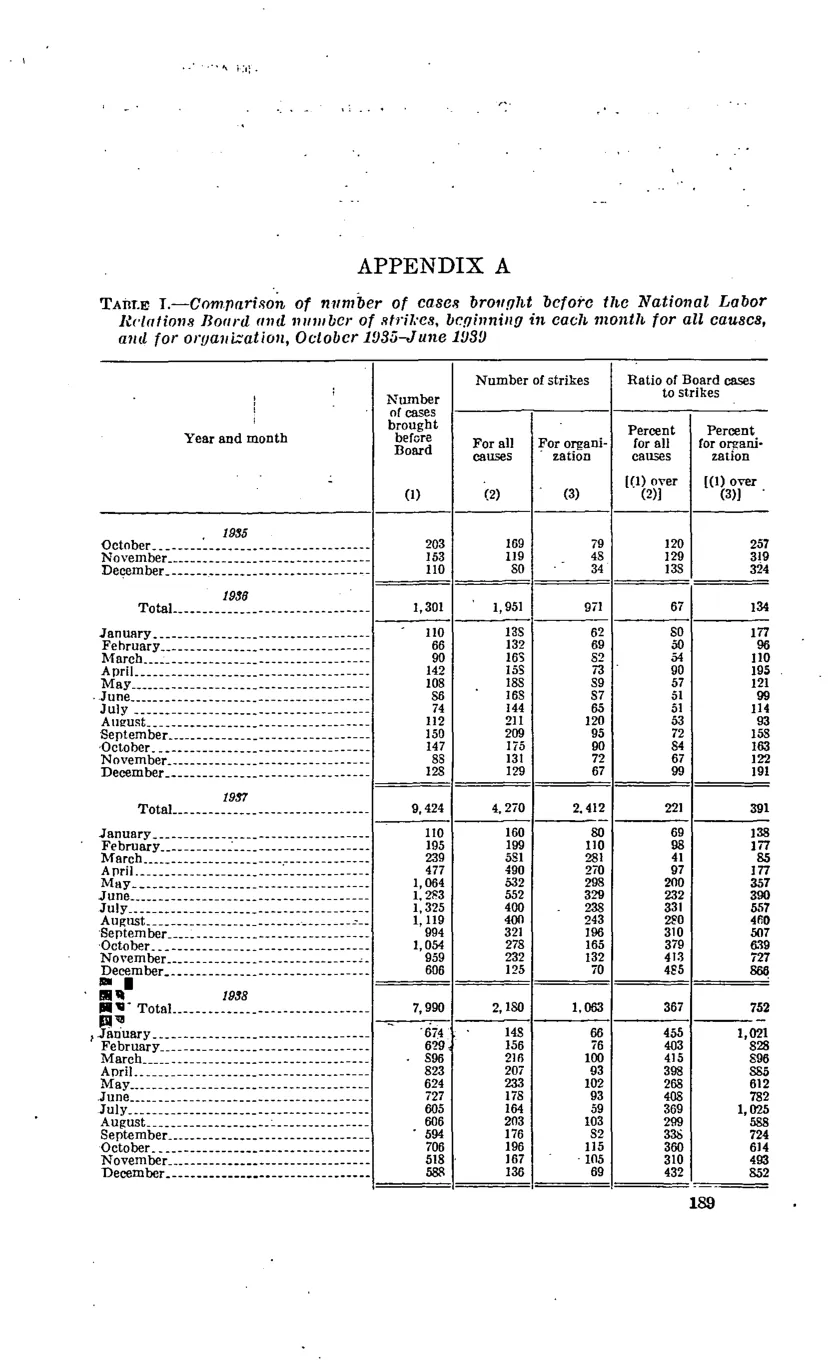
Cases brought before the NLRB compared with number of strikes
| Year and month | Number of cases brought before Board (1) | Number of strikes — For all causes (2) | Number of strikes — For organization (3) | Ratio of Board cases to strikes — Percent for all causes [(1) over (2)] | Ratio of Board cases to strikes — Percent for organization [(1) over (3)] |
|---|---|---|---|---|---|
| 1935 — October | 203 | 169 | 79 | 120 | 257 |
| 1935 — November | 153 | 119 | 48 | 129 | 319 |
| 1935 — December | 110 | 80 | 34 | 138 | 324 |
| 1936 — Total | 1,301 | 1,951 | 971 | 67 | 134 |
| 1937 — Total | 9,424 | 4,270 | 2,412 | 221 | 391 |
| 1938 — Total | 7,990 | 2,180 | 1,063 | 367 | 752 |
| 1939 — January | 674 | 148 | 66 | 455 | 1,021 |
Source image
Source data: U.S. NLRB Annual Reports (public domain). Reconstruction by NLRB Stats Archive. Updated June 2026.