NLRB Stats Archive › Annual Reports › FY1939 › Disposition of representation cases on docket during the fiscal year ending June 30, 1939, by regions
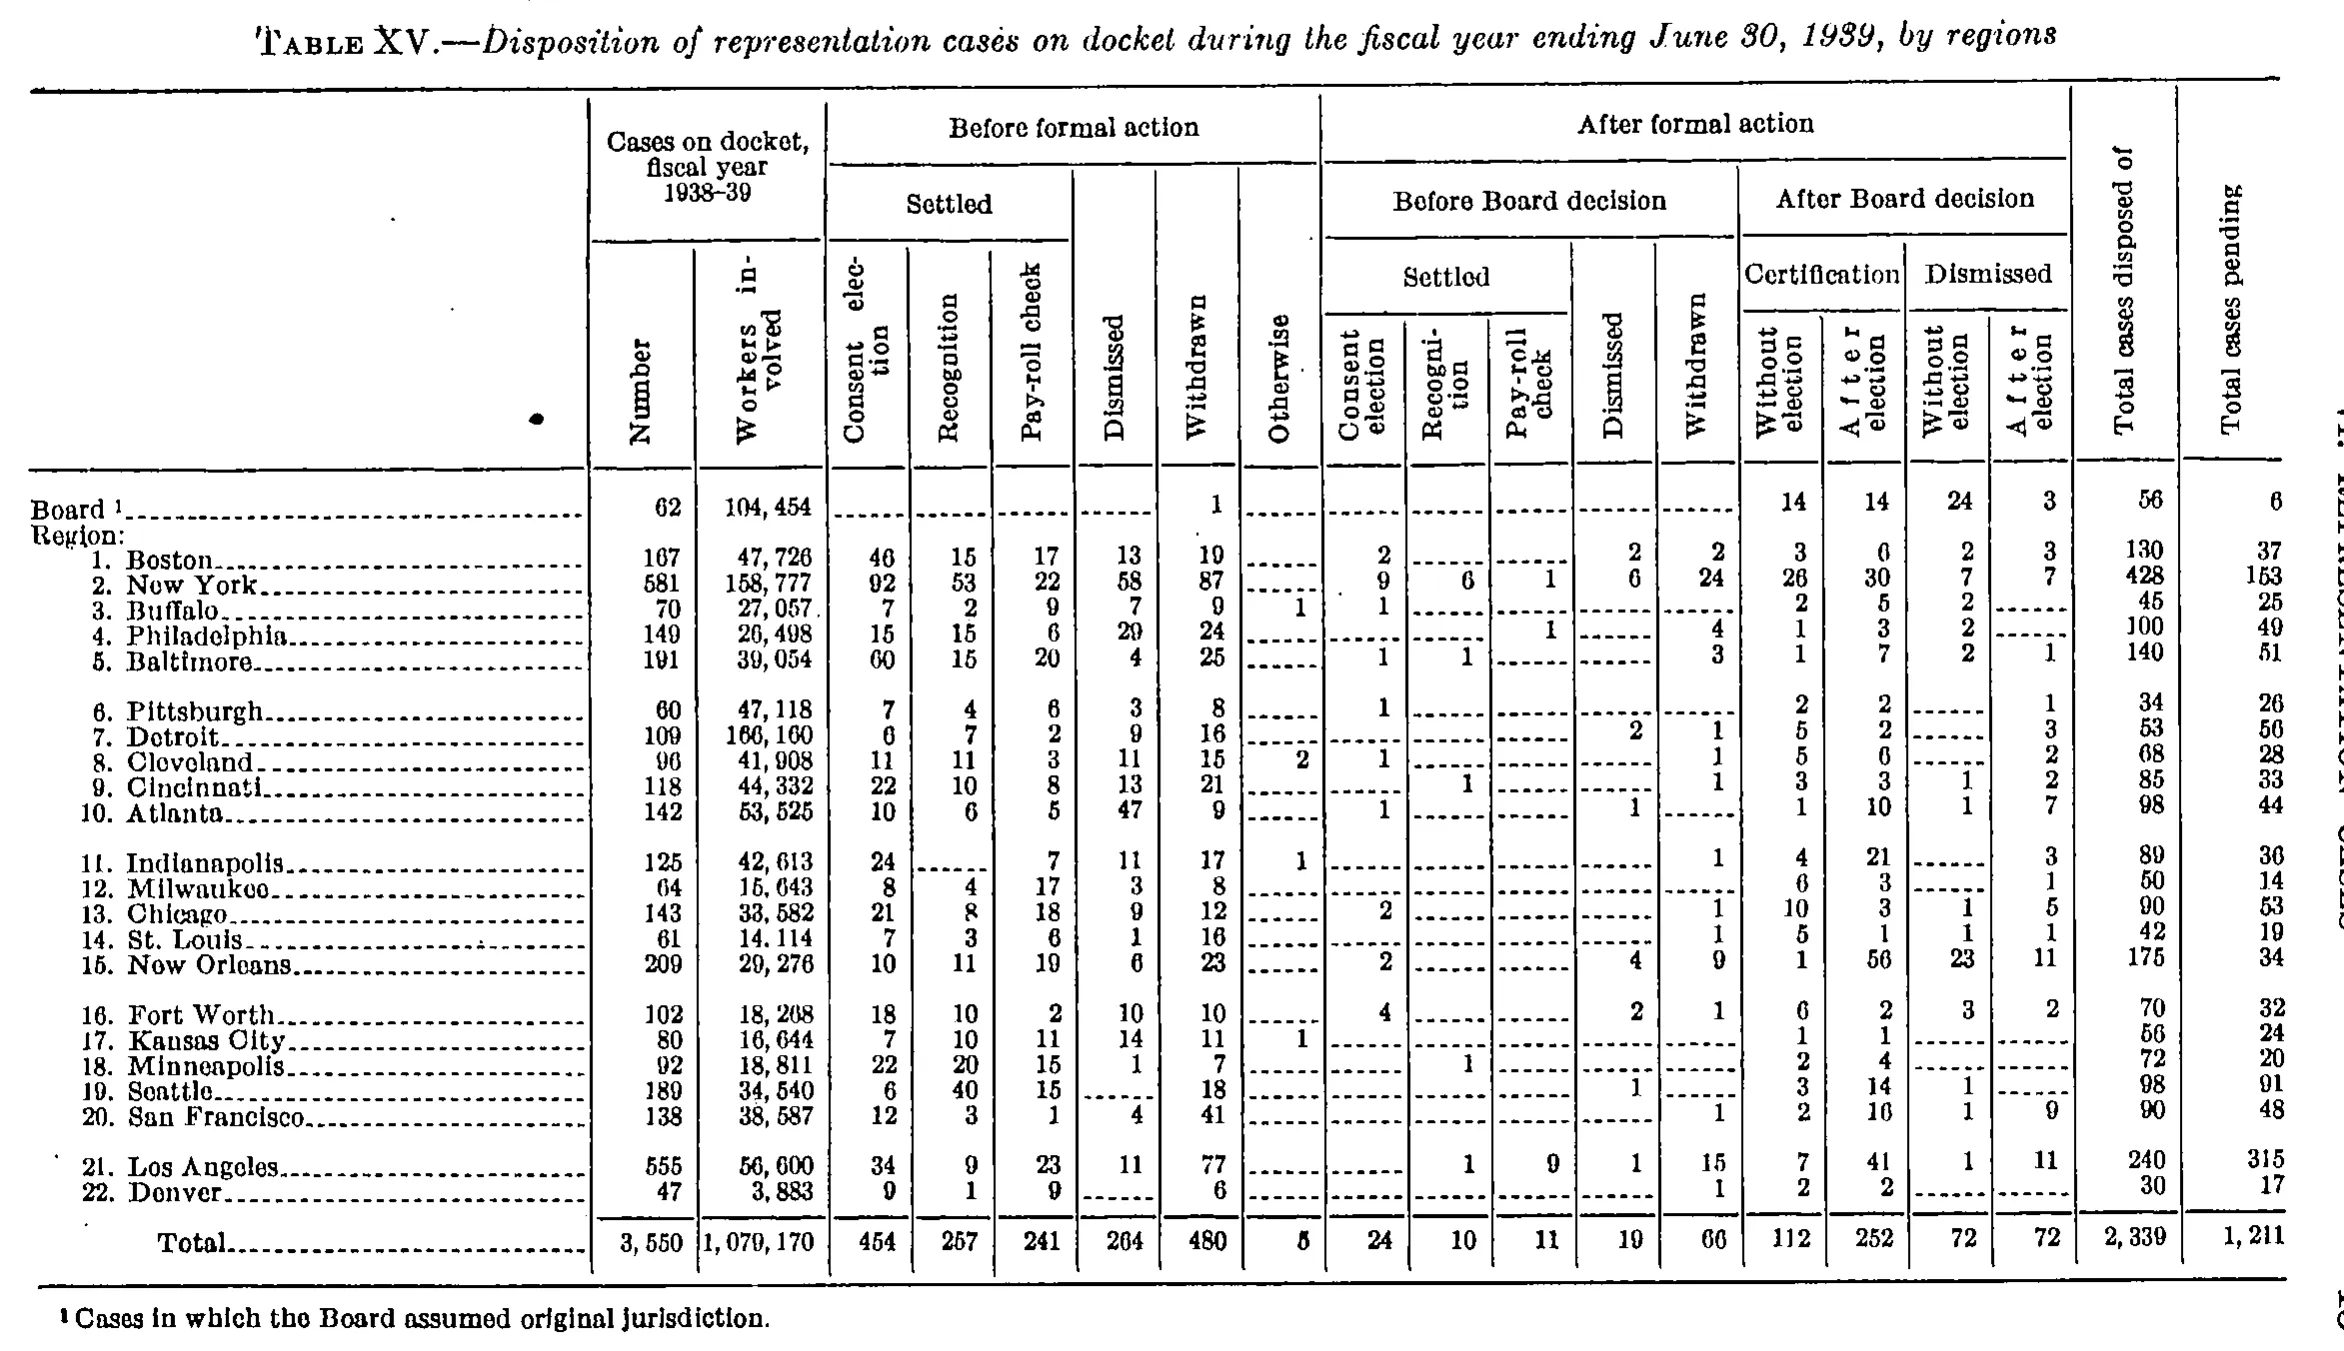
Disposition of representation cases on docket during the fiscal year ending June 30, 1939, by regions
| Cases on docket, fiscal year 1938-39 | Before formal action | After formal action | Total cases disposed of | Total cases pending | |||||||||||||||
|---|---|---|---|---|---|---|---|---|---|---|---|---|---|---|---|---|---|---|---|
| Cases on docket, fiscal year 1938-39 | Settled | Dismissed | Withdrawn | Otherwise | Before Board decision | After Board decision | Total cases disposed of | Total cases pending | |||||||||||
| Number | Workers involved | Consent election | Recognition | Pay-roll check | Dismissed | Withdrawn | Otherwise | Settled | Dismissed | Withdrawn | Certification | Dismissed | Total cases disposed of | Total cases pending | |||||
| Number | Workers involved | Consent election | Recognition | Pay-roll check | Dismissed | Withdrawn | Otherwise | Consent election | Recognition | Pay-roll check | Dismissed | Withdrawn | Without election | After election | Without election | After election | Total cases disposed of | Total cases pending | |
| Board | 62 | 104,454 | 1 | 14 | 14 | 24 | 3 | 56 | 6 | ||||||||||
| Region: | |||||||||||||||||||
| 1. Boston | 167 | 47,726 | 46 | 15 | 17 | 13 | 19 | 2 | 2 | 2 | 3 | 6 | 2 | 3 | 130 | 37 | |||
| 2. New York | 581 | 158,777 | 92 | 53 | 22 | 58 | 87 | 9 | 6 | 1 | 6 | 24 | 26 | 30 | 7 | 7 | 428 | 153 | |
| 3. Buffalo | 70 | 27,057 | 7 | 2 | 9 | 7 | 9 | 1 | 1 | 2 | 5 | 2 | 45 | 25 | |||||
| 4. Philadelphia | 149 | 26,498 | 15 | 15 | 6 | 29 | 24 | 1 | 4 | 1 | 3 | 2 | 100 | 49 | |||||
| 5. Baltimore | 191 | 39,054 | 60 | 15 | 20 | 4 | 25 | 1 | 1 | 3 | 1 | 7 | 2 | 1 | 140 | 51 | |||
| 6. Pittsburgh | 60 | 47,118 | 7 | 4 | 6 | 3 | 8 | 1 | 2 | 2 | 1 | 34 | 26 | ||||||
| 7. Detroit | 109 | 166,160 | 6 | 7 | 2 | 9 | 16 | 2 | 1 | 5 | 2 | 3 | 53 | 56 | |||||
| 8. Cleveland | 96 | 41,908 | 11 | 11 | 3 | 11 | 15 | 2 | 1 | 1 | 5 | 6 | 2 | 68 | 28 | ||||
| 9. Cincinnati | 118 | 44,332 | 22 | 10 | 8 | 13 | 21 | 1 | 1 | 3 | 3 | 1 | 2 | 85 | 33 | ||||
| 10. Atlanta | 142 | 53,525 | 10 | 6 | 5 | 47 | 9 | 1 | 1 | 1 | 10 | 1 | 7 | 98 | 44 | ||||
| 11. Indianapolis | 125 | 42,613 | 24 | 7 | 11 | 17 | 1 | 1 | 4 | 21 | 3 | 89 | 36 | ||||||
| 12. Milwaukee | 64 | 15,643 | 8 | 4 | 17 | 3 | 8 | 6 | 3 | 1 | 50 | 14 | |||||||
| 13. Chicago | 143 | 33,582 | 21 | 8 | 18 | 9 | 12 | 2 | 1 | 10 | 3 | 1 | 5 | 90 | 53 | ||||
| 14. St. Louis | 61 | 14,114 | 7 | 3 | 6 | 1 | 16 | 1 | 5 | 1 | 1 | 1 | 42 | 19 | |||||
| 15. New Orleans | 209 | 29,276 | 10 | 11 | 19 | 6 | 23 | 2 | 4 | 9 | 1 | 56 | 23 | 11 | 175 | 34 | |||
| 16. Fort Worth | 102 | 18,268 | 18 | 10 | 2 | 10 | 10 | 4 | 2 | 1 | 6 | 2 | 3 | 2 | 70 | 32 | |||
| 17. Kansas City | 80 | 16,644 | 7 | 10 | 11 | 14 | 11 | 1 | 1 | 1 | 56 | 24 | |||||||
| 18. Minneapolis | 92 | 18,811 | 22 | 20 | 15 | 1 | 7 | 1 | 2 | 4 | 72 | 20 | |||||||
| 19. Seattle | 189 | 34,540 | 6 | 40 | 15 | 18 | 1 | 3 | 14 | 1 | 98 | 91 | |||||||
| 20. San Francisco | 138 | 38,587 | 12 | 3 | 1 | 4 | 41 | 1 | 2 | 16 | 1 | 9 | 90 | 48 | |||||
| 21. Los Angeles | 555 | 56,600 | 34 | 9 | 23 | 11 | 77 | 1 | 9 | 1 | 15 | 7 | 41 | 1 | 11 | 240 | 315 | ||
| 22. Denver | 47 | 3,883 | 9 | 1 | 9 | 6 | 1 | 2 | 2 | 30 | 17 | ||||||||
| Total | 3,550 | 1,079,170 | 454 | 257 | 241 | 264 | 480 | 5 | 24 | 10 | 11 | 19 | 66 | 112 | 252 | 72 | 72 | 2,339 | 1,211 |
- 1 Cases in which the Board assumed original jurisdiction.
342 of 342 figures sit in a row or column sum that works out.
Reader’s notes
p. 52. 20 columns. The stub column carries no printed heading (only a stray ink dot sits in that box), so cell 0 of each heading level is empty. "Cases on docket, fiscal year 1938-39" spans heading levels 1-2 over the Number / Workers involved pair; "Total cases disposed of" and "Total cases pending" are tall single headings spanning all four levels, as are "Dismissed"/"Withdrawn"/"Otherwise" under "Before formal action" (levels 2-4) and "Dismissed"/"Withdrawn" under "Before Board decision" (levels 3-4). Wrapped/letter-spaced headings joined: "Workers in-volved" -> "Workers involved", "Recogni-tion" -> "Recognition", "A f t e r election" -> "After election". The year span is printed with an en dash (1938–39); transcribed with a plain hyphen. Verification: every row total ("Total cases disposed of") and all 19 numeric column totals reconcile exactly with the printed "Total" line, so the grid is internally consistent and no misprints were detected. This arithmetic resolved the 0/6/9 glyph ambiguities of this 1-bit scan, which were the only doubtful cells: Philadelphia "Dismissed" (before formal action) is 29 not 20; Detroit "Consent election" (before formal action) is 6 not 0; Boston and Cleveland "Certification, after election" are 6; Milwaukee and Fort Worth "Certification, without election" are 6; San Francisco "Certification, after election" is 16 not 10; Indianapolis "Total cases pending" is 36 not 30; Detroit and Pittsburgh "Total cases pending" are 56 and 26. Blank cells in the body are printed as leader-dot rules and are transcribed as empty. A vertical running head and page number are cropped at the right edge of the image and are excluded per instructions.
Source image
Source data: U.S. NLRB Annual Reports (public domain). Reconstruction by NLRB Stats Archive. Read by claude-opus-5 (effort max, prompt extract_v1) from the 300-dpi scan; stitched by page. Updated October 2026.