NLRB Stats Archive › Annual Reports › FY1939 › Formal action taken by N. L. R. B. in unfair labor practice cases on docket during fiscal year ending June 30, 1939, by regions
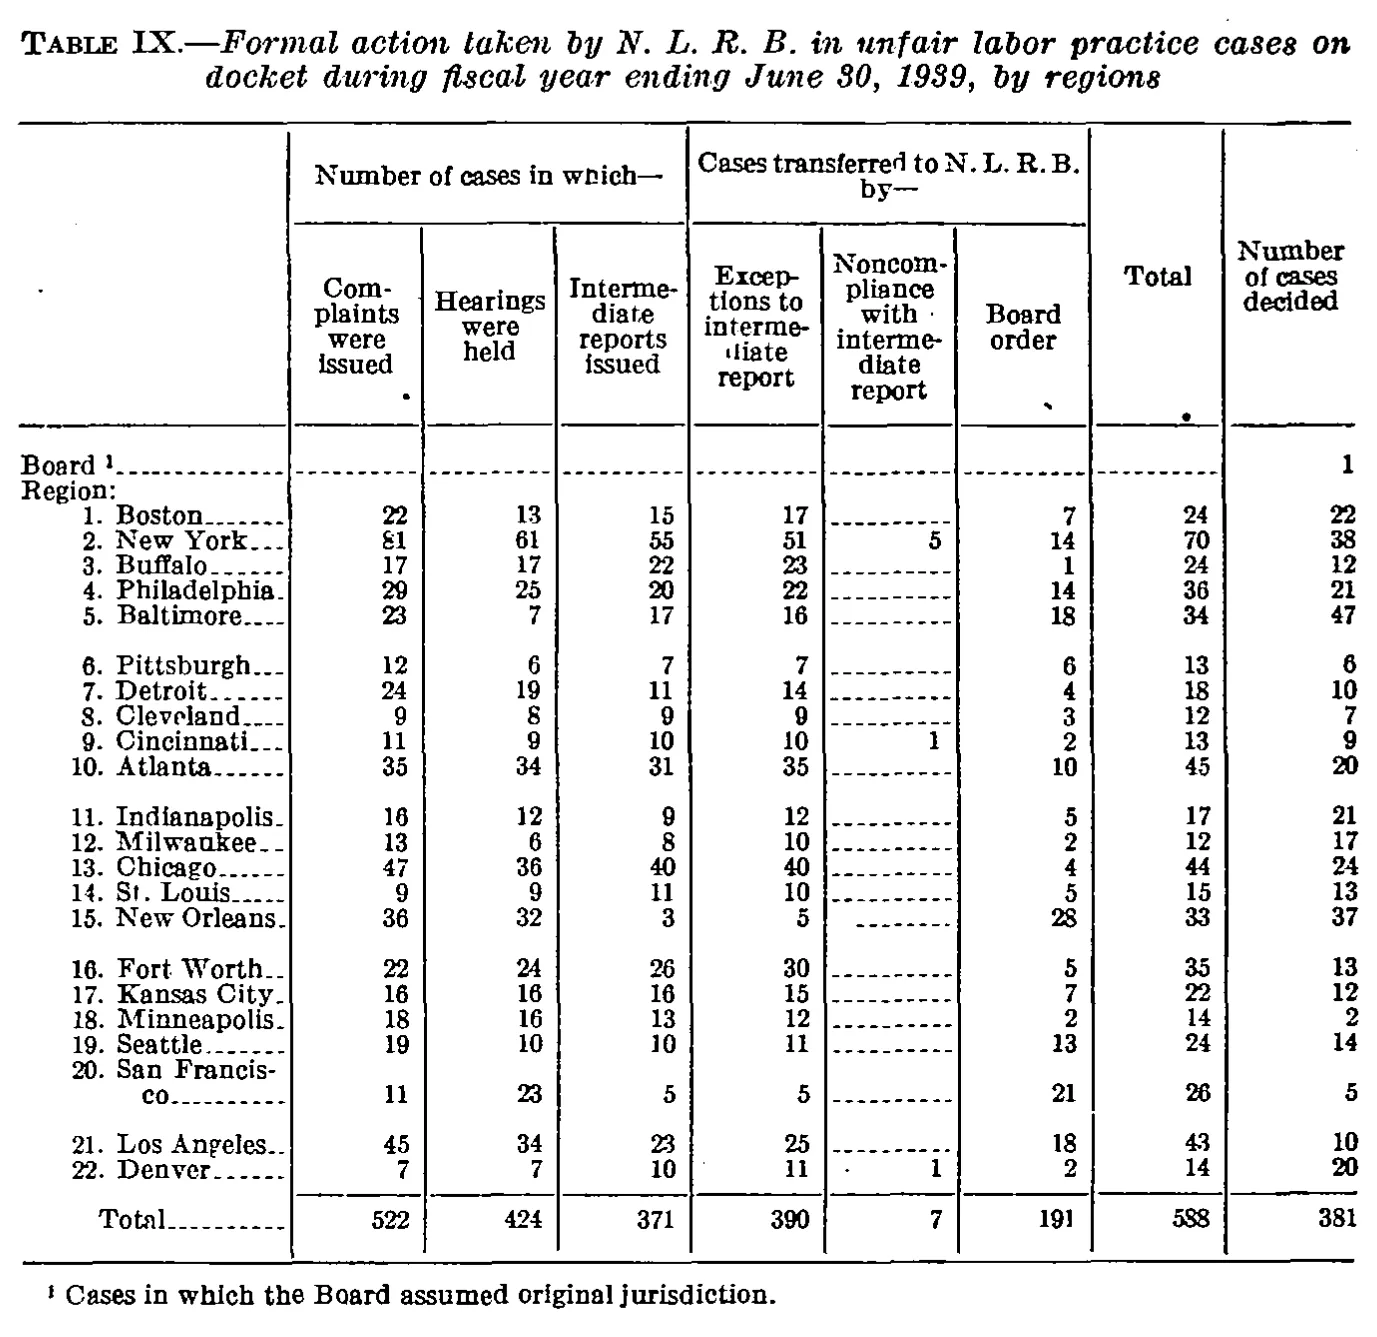
Formal action taken by N. L. R. B. in unfair labor practice cases on docket during fiscal year ending June 30, 1939, by regions
| Number of cases in which— | Cases transferred to N. L. R. B. by— | Total | Number of cases decided | |||||
|---|---|---|---|---|---|---|---|---|
| Complaints were issued | Hearings were held | Intermediate reports issued | Exceptions to intermediate report | Noncompliance with intermediate report | Board order | Total | Number of cases decided | |
| Board | 1 | |||||||
| Region: | ||||||||
| 1. Boston | 22 | 13 | 15 | 17 | 7 | 24 | 22 | |
| 2. New York | 81 | 61 | 55 | 51 | 5 | 14 | 70 | 38 |
| 3. Buffalo | 17 | 17 | 22 | 23 | 1 | 24 | 12 | |
| 4. Philadelphia | 29 | 25 | 20 | 22 | 14 | 36 | 21 | |
| 5. Baltimore | 23 | 7 | 17 | 16 | 18 | 34 | 47 | |
| 6. Pittsburgh | 12 | 6 | 7 | 7 | 6 | 13 | 6 | |
| 7. Detroit | 24 | 19 | 11 | 14 | 4 | 18 | 10 | |
| 8. Cleveland | 9 | 8 | 9 | 9 | 3 | 12 | 7 | |
| 9. Cincinnati | 11 | 9 | 10 | 10 | 1 | 2 | 13 | 9 |
| 10. Atlanta | 35 | 34 | 31 | 35 | 10 | 45 | 20 | |
| 11. Indianapolis | 16 | 12 | 9 | 12 | 5 | 17 | 21 | |
| 12. Milwaukee | 13 | 6 | 8 | 10 | 2 | 12 | 17 | |
| 13. Chicago | 47 | 36 | 40 | 40 | 4 | 44 | 24 | |
| 14. St. Louis | 9 | 9 | 11 | 10 | 5 | 15 | 13 | |
| 15. New Orleans | 36 | 32 | 3 | 5 | 28 | 33 | 37 | |
| 16. Fort Worth | 22 | 24 | 26 | 30 | 5 | 35 | 13 | |
| 17. Kansas City | 16 | 16 | 16 | 15 | 7 | 22 | 12 | |
| 18. Minneapolis | 18 | 16 | 13 | 12 | 2 | 14 | 2 | |
| 19. Seattle | 19 | 10 | 10 | 11 | 13 | 24 | 14 | |
| 20. San Francisco | 11 | 23 | 5 | 5 | 21 | 26 | 5 | |
| 21. Los Angeles | 45 | 34 | 23 | 25 | 18 | 43 | 10 | |
| 22. Denver | 7 | 7 | 10 | 11 | 1 | 2 | 14 | 20 |
| Total | 522 | 424 | 371 | 390 | 7 | 191 | 588 | 381 |
- 1 Cases in which the Board assumed original jurisdiction.
142 of 166 figures sit in a row or column sum that works out. 1 cell breaks a sum: 'Total', column 9: prints 381, rows '1. Boston' to '22. Denver' add to 380.
Reader’s notes
p. 44. Nine columns: stub, three under "Number of cases in which—", three under "Cases transferred to N. L. R. B. by—", then "Total" and "Number of cases decided", which are tall single headings spanning both heading levels. The stub column has no printed heading (only a stray ink dot), so it is "" in both heading rows. The "Board^1" row is ruled with dashes across all columns except the last, where it carries 1; "Region:" is a section line with no values. In the "Noncompliance with intermediate report" column every region except New York (5), Cincinnati (1) and Denver (1) shows a dash rule, transcribed as "". The row label "20. San Francis-co" is printed over two lines with its figures on the second line; it is joined here into one row, "20. San Francisco". All eight value columns were checked against the printed Total row and every one foots exactly: 522, 424, 371, 390, 7, 191, 588, and 381 (the last being 380 for the 22 regions plus the 1 on the Board row). The "Total" column also equals exceptions + noncompliance + board order for every region. No misprints detected. Scan artifacts worth naming: the leading digit of "81" for 2. New York is broken and reads like a pound sign, but the column sum confirms 81; the "e" in "8. Cleveland" and the "u" in "12. Milwaukee" are likewise degraded but unambiguous.
Source image
Source data: U.S. NLRB Annual Reports (public domain). Reconstruction by NLRB Stats Archive. Read by claude-opus-5 (effort max, prompt extract_v1) from the 300-dpi scan; stitched by page. Updated October 2026.