NLRB Stats Archive › Annual Reports › FY1939 › Disposition of unfair labor practice cases on docket during the fiscal year ending June 30, 1939, by regions
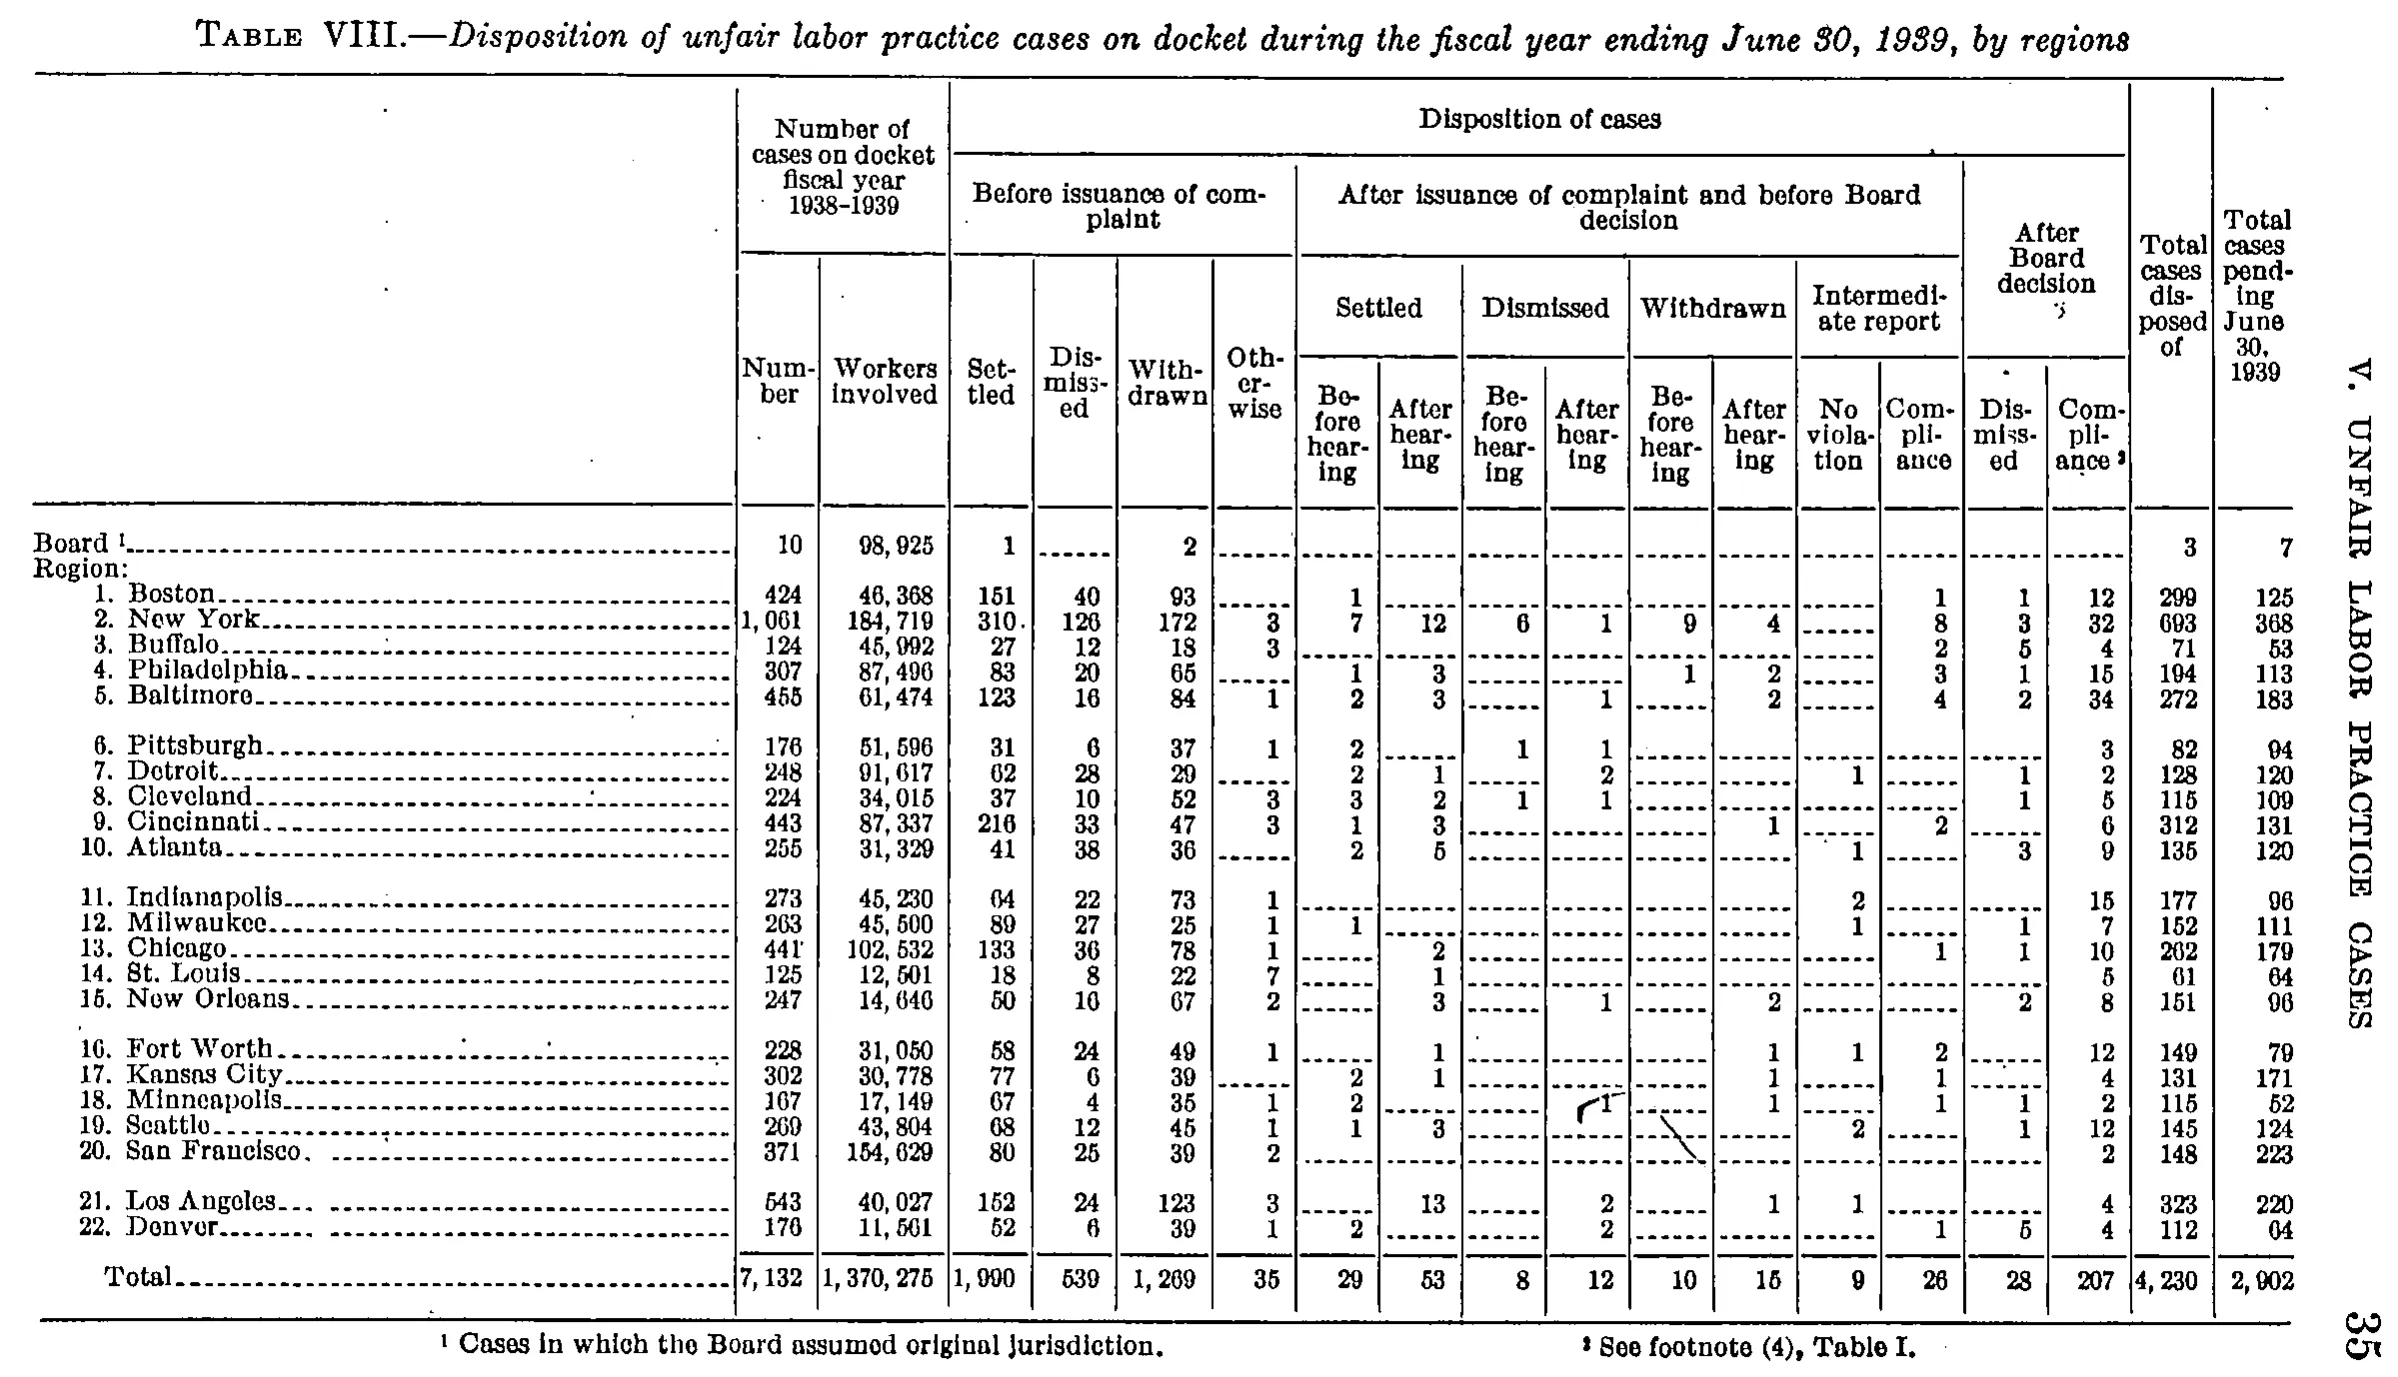
Disposition of unfair labor practice cases on docket during the fiscal year ending June 30, 1939, by regions
| Number of cases on docket fiscal year 1938-1939 | Disposition of cases | Total cases disposed of | Total cases pending June 30, 1939 | |||||||||||||||
|---|---|---|---|---|---|---|---|---|---|---|---|---|---|---|---|---|---|---|
| Number of cases on docket fiscal year 1938-1939 | Before issuance of complaint | After issuance of complaint and before Board decision | After Board decision | Total cases disposed of | Total cases pending June 30, 1939 | |||||||||||||
| Number of cases on docket fiscal year 1938-1939 | Before issuance of complaint | Settled | Dismissed | Withdrawn | Intermediate report | After Board decision | Total cases disposed of | Total cases pending June 30, 1939 | ||||||||||
| Number | Workers involved | Settled | Dismissed | Withdrawn | Otherwise | Before hearing | After hearing | Before hearing | After hearing | Before hearing | After hearing | No violation | Compliance | Dismissed | Compliance | Total cases disposed of | Total cases pending June 30, 1939 | |
| Board | 10 | 98,925 | 1 | 2 | 3 | 7 | ||||||||||||
| Region: | ||||||||||||||||||
| 1. Boston | 424 | 46,368 | 151 | 40 | 93 | 1 | 1 | 1 | 12 | 299 | 125 | |||||||
| 2. New York | 1,061 | 184,719 | 310 | 126 | 172 | 3 | 7 | 12 | 6 | 1 | 9 | 4 | 8 | 3 | 32 | 693 | 368 | |
| 3. Buffalo | 124 | 45,992 | 27 | 12 | 18 | 3 | 2 | 5 | 4 | 71 | 53 | |||||||
| 4. Philadelphia | 307 | 87,496 | 83 | 20 | 65 | 1 | 3 | 1 | 2 | 3 | 1 | 15 | 194 | 113 | ||||
| 5. Baltimore | 455 | 61,474 | 123 | 16 | 84 | 1 | 2 | 3 | 1 | 2 | 4 | 2 | 34 | 272 | 183 | |||
| 6. Pittsburgh | 176 | 51,596 | 31 | 6 | 37 | 1 | 2 | 1 | 1 | 3 | 82 | 94 | ||||||
| 7. Detroit | 248 | 91,617 | 62 | 28 | 29 | 2 | 1 | 2 | 1 | 1 | 2 | 128 | 120 | |||||
| 8. Cleveland | 224 | 34,015 | 37 | 10 | 52 | 3 | 3 | 2 | 1 | 1 | 1 | 5 | 115 | 109 | ||||
| 9. Cincinnati | 443 | 87,337 | 216 | 33 | 47 | 3 | 1 | 3 | 1 | 2 | 6 | 312 | 131 | |||||
| 10. Atlanta | 255 | 31,329 | 41 | 38 | 36 | 2 | 5 | 1 | 3 | 9 | 135 | 120 | ||||||
| 11. Indianapolis | 273 | 45,230 | 64 | 22 | 73 | 1 | 2 | 15 | 177 | 96 | ||||||||
| 12. Milwaukee | 263 | 45,500 | 89 | 27 | 25 | 1 | 1 | 1 | 1 | 7 | 152 | 111 | ||||||
| 13. Chicago | 441 | 102,532 | 133 | 36 | 78 | 1 | 2 | 1 | 1 | 10 | 262 | 179 | ||||||
| 14. St. Louis | 125 | 12,501 | 18 | 8 | 22 | 7 | 1 | 5 | 61 | 64 | ||||||||
| 15. New Orleans | 247 | 14,646 | 50 | 16 | 67 | 2 | 3 | 1 | 2 | 2 | 8 | 151 | 96 | |||||
| 16. Fort Worth | 228 | 31,050 | 58 | 24 | 49 | 1 | 1 | 1 | 1 | 2 | 12 | 149 | 79 | |||||
| 17. Kansas City | 302 | 30,778 | 77 | 6 | 39 | 2 | 1 | 1 | 1 | 4 | 131 | 171 | ||||||
| 18. Minneapolis | 167 | 17,149 | 67 | 4 | 35 | 1 | 2 | 1 | 1 | 1 | 1 | 2 | 115 | 52 | ||||
| 19. Seattle | 269 | 43,804 | 68 | 12 | 45 | 1 | 1 | 3 | 2 | 1 | 12 | 145 | 124 | |||||
| 20. San Francisco | 371 | 154,629 | 80 | 25 | 39 | 2 | 2 | 148 | 223 | |||||||||
| 21. Los Angeles | 543 | 40,027 | 152 | 24 | 123 | 3 | 13 | 2 | 1 | 1 | 4 | 323 | 220 | |||||
| 22. Denver | 176 | 11,561 | 52 | 6 | 39 | 1 | 2 | 2 | 1 | 5 | 4 | 112 | 64 | |||||
| Total | 7,132 | 1,370,275 | 1,990 | 539 | 1,269 | 35 | 29 | 53 | 8 | 12 | 10 | 15 | 9 | 26 | 28 | 207 | 4,230 | 2,902 |
- 1 Cases in which the Board assumed original jurisdiction.
- 2 See footnote (4), Table I.
300 of 300 figures sit in a row or column sum that works out.
Reader’s notes
p. 42. 19 columns. The stub has no printed heading, so cell 0 is empty in all four heading levels. "Number of cases on docket fiscal year 1938-1939", "Total cases disposed of" and "Total cases pending June 30, 1939" are tall headings spanning all four levels; "Before issuance of complaint" and "After Board decision" span levels 2-3; they are repeated in every level and column they span. Nil entries are printed as dash rules (------) throughout the body and are transcribed as "". The scan is a low-contrast 1-bit image in which several 6s and 9s render much like 0s at the available resolution. I therefore checked the whole grid arithmetically: all 18 column totals against the printed "Total" row, and every region row against its printed "Total cases disposed of" and the identity Number - disposed = pending. All 18 column totals and all 23 row identities reconcile exactly as transcribed — notably "Workers involved" sums to precisely the printed 1,370,275. That resolves the doubtful glyphs, which I read as: Pittsburgh "Total cases pending" 94; Indianapolis "Before issuance of complaint - Settled" 64; Chicago "Total cases disposed of" 262; Buffalo "Workers involved" 45,992; New Orleans "Before issuance of complaint - Dismissed" 16; Denver and St. Louis "Total cases pending" 64. No printed figure appears to be a misprint. Two placements worth flagging, both settled by the column totals rather than by the pixels alone: Detroit's "1" sits in "Settled - After hearing" (not "Dismissed - Before hearing"), and Seattle's "2" sits in "Intermediate report - No violation" (not "Compliance"). The Minneapolis row carries a stray curved ink or pencil stroke through the "Dismissed - After hearing" cell; the digit under it is legible as 1 and both the row and the column total confirm it. The footnote marker attached to "Compliance" in the "After Board decision" group, and the marker opening the second footnote, are a small raised digit that could be read as either 2 or 3 at this resolution. I transcribed both as 2, since the table prints only two footnotes and the first is numbered 1. There is also a faint speck under the "After Board decision" heading that I take to be scan dirt rather than a marker. The caption, the running head "V. UNFAIR LABOR PRACTICE CASES" set vertically in the right margin, and the page number 35 are omitted. Nothing is cut off by the crop.
Source image
Source data: U.S. NLRB Annual Reports (public domain). Reconstruction by NLRB Stats Archive. Read by claude-opus-5 (effort max, prompt extract_v1) from the 300-dpi scan; stitched by page. Updated October 2026.