NLRB Stats Archive › Annual Reports › FY1939 › Analyses of charges received during fiscal year ending June 30, 1939
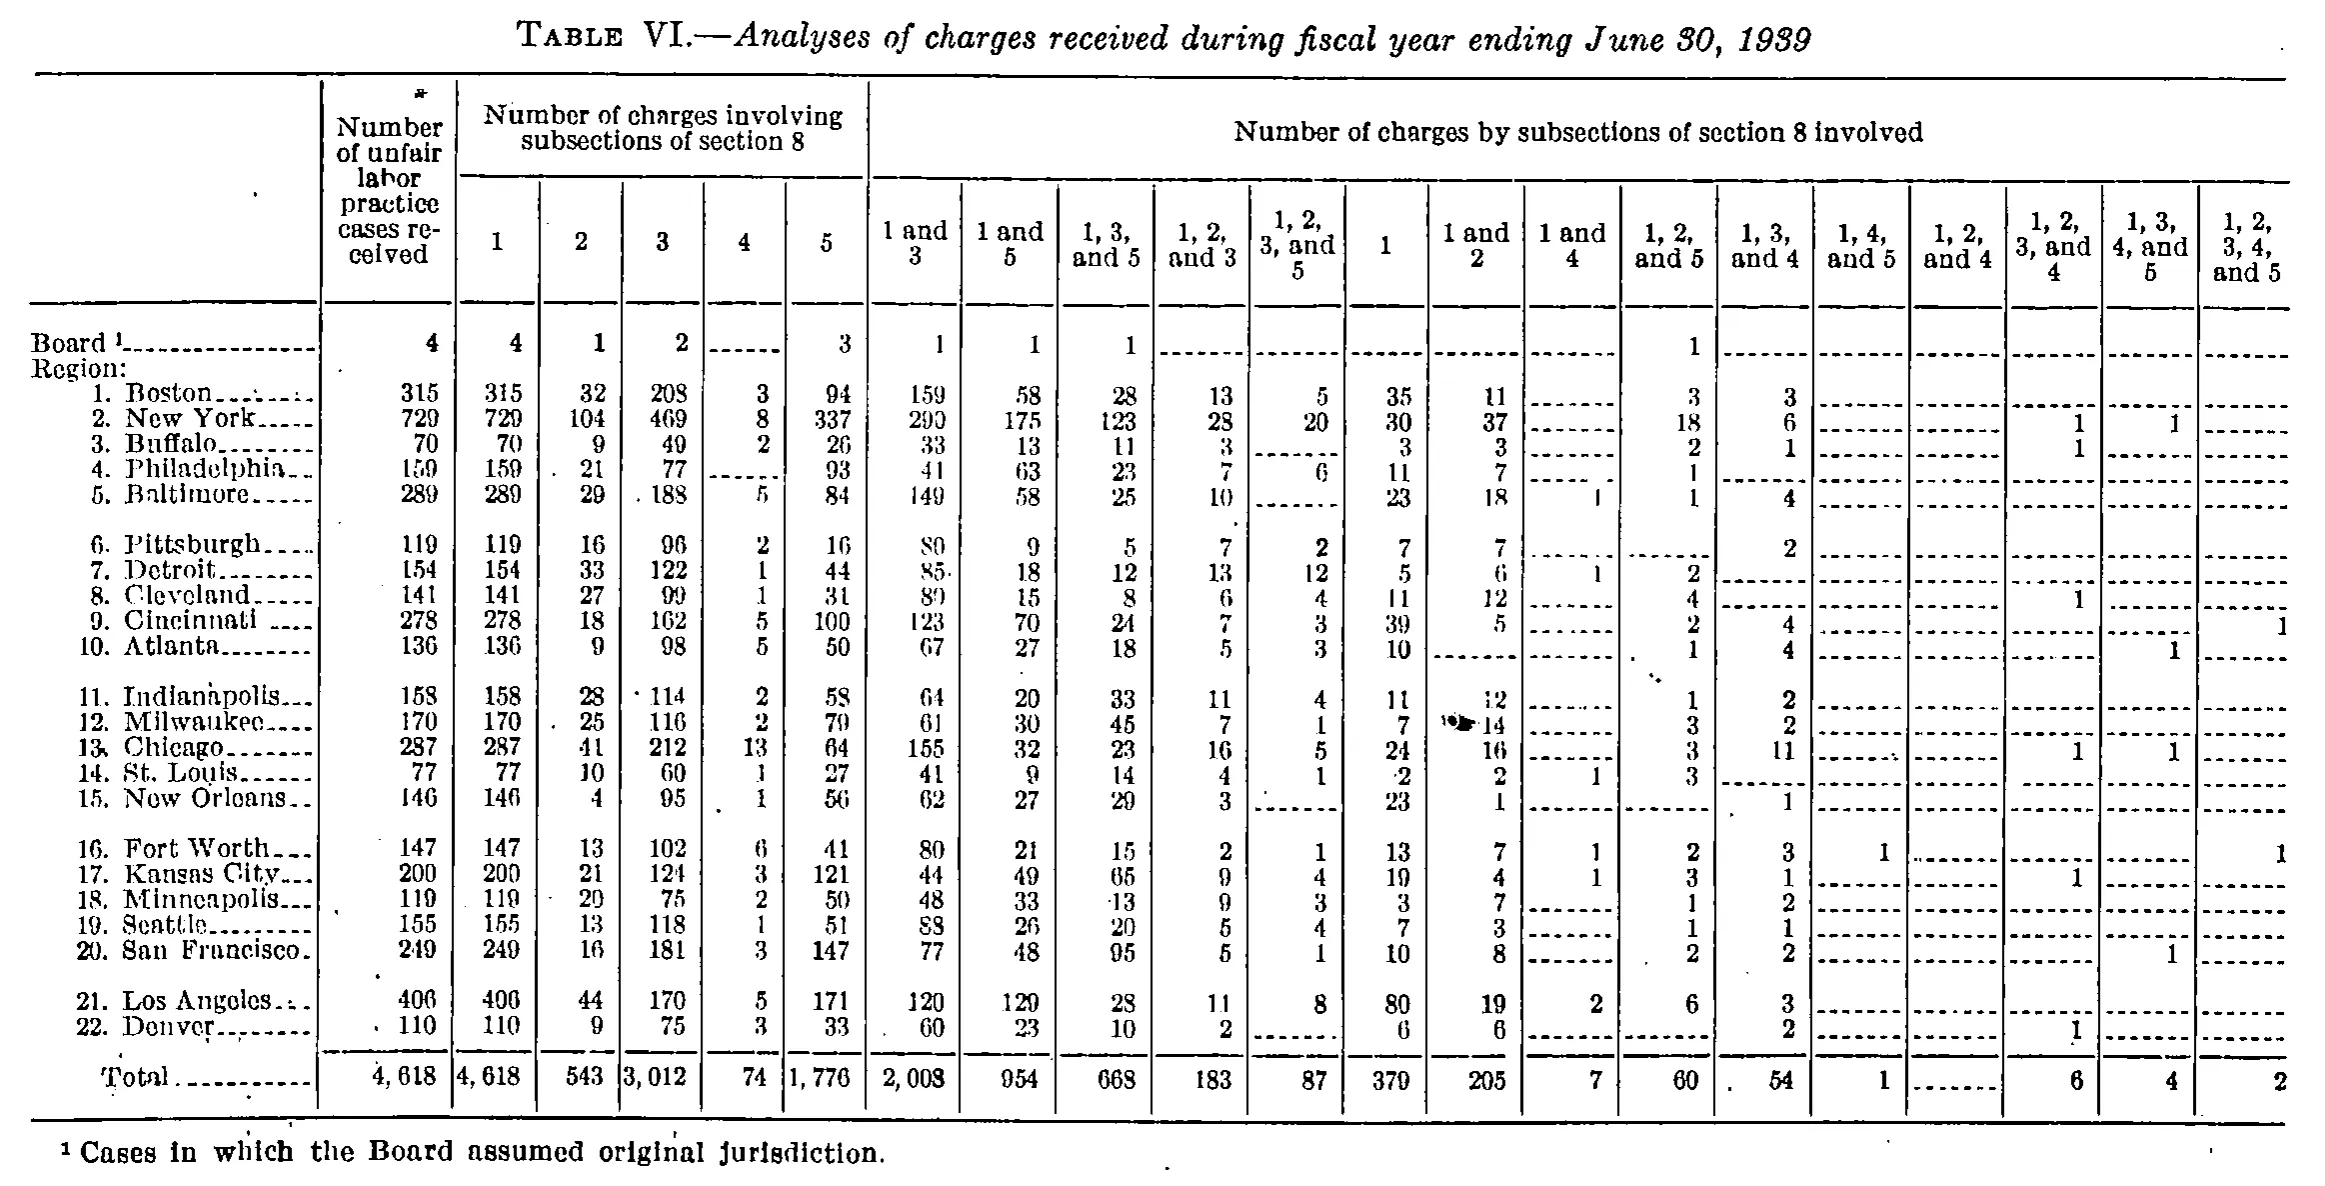
Analyses of charges received during fiscal year ending June 30, 1939
| Number of unfair labor practice cases received | Number of charges involving subsections of section 8 | Number of charges by subsections of section 8 involved | |||||||||||||||||||
|---|---|---|---|---|---|---|---|---|---|---|---|---|---|---|---|---|---|---|---|---|---|
| Number of unfair labor practice cases received | 1 | 2 | 3 | 4 | 5 | 1 and 3 | 1 and 5 | 1, 3, and 5 | 1, 2, and 3 | 1, 2, 3, and 5 | 1 | 1 and 2 | 1 and 4 | 1, 2, and 5 | 1, 3, and 4 | 1, 4, and 5 | 1, 2, and 4 | 1, 2, 3, and 4 | 1, 3, 4, and 5 | 1, 2, 3, 4, and 5 | |
| Board | 4 | 4 | 1 | 2 | 3 | 1 | 1 | 1 | 1 | ||||||||||||
| Region: | |||||||||||||||||||||
| 1. Boston | 315 | 315 | 32 | 208 | 3 | 94 | 159 | 58 | 28 | 13 | 5 | 35 | 11 | 3 | 3 | ||||||
| 2. New York | 729 | 729 | 104 | 469 | 8 | 337 | 290 | 175 | 123 | 28 | 20 | 30 | 37 | 18 | 6 | 1 | 1 | ||||
| 3. Buffalo | 70 | 70 | 9 | 49 | 2 | 26 | 33 | 13 | 11 | 3 | 3 | 3 | 2 | 1 | 1 | ||||||
| 4. Philadelphia | 159 | 159 | 21 | 77 | 93 | 41 | 63 | 23 | 7 | 6 | 11 | 7 | 1 | ||||||||
| 5. Baltimore | 289 | 289 | 29 | 188 | 5 | 84 | 149 | 58 | 25 | 10 | 23 | 18 | 1 | 1 | 4 | ||||||
| 6. Pittsburgh | 119 | 119 | 16 | 96 | 2 | 16 | 80 | 9 | 5 | 7 | 2 | 7 | 7 | 2 | |||||||
| 7. Detroit | 154 | 154 | 33 | 122 | 1 | 44 | 85 | 18 | 12 | 13 | 12 | 5 | 6 | 1 | 2 | ||||||
| 8. Cleveland | 141 | 141 | 27 | 99 | 1 | 31 | 80 | 15 | 8 | 6 | 4 | 11 | 12 | 4 | 1 | ||||||
| 9. Cincinnati | 278 | 278 | 18 | 162 | 5 | 100 | 123 | 70 | 24 | 7 | 3 | 39 | 5 | 2 | 4 | 1 | |||||
| 10. Atlanta | 136 | 136 | 9 | 98 | 5 | 50 | 67 | 27 | 18 | 5 | 3 | 10 | 1 | 4 | 1 | ||||||
| 11. Indianapolis | 158 | 158 | 28 | 114 | 2 | 58 | 64 | 20 | 33 | 11 | 4 | 11 | 12 | 1 | 2 | ||||||
| 12. Milwaukee | 170 | 170 | 25 | 116 | 2 | 79 | 61 | 30 | 45 | 7 | 1 | 7 | 14 | 3 | 2 | ||||||
| 13. Chicago | 287 | 287 | 41 | 212 | 13 | 64 | 155 | 32 | 23 | 16 | 5 | 24 | 16 | 3 | 11 | 1 | 1 | ||||
| 14. St. Louis | 77 | 77 | 10 | 60 | 1 | 27 | 41 | 9 | 14 | 4 | 1 | 2 | 2 | 1 | 3 | ||||||
| 15. New Orleans | 146 | 146 | 4 | 95 | 1 | 56 | 62 | 27 | 29 | 3 | 23 | 1 | 1 | ||||||||
| 16. Fort Worth | 147 | 147 | 13 | 102 | 6 | 41 | 80 | 21 | 15 | 2 | 1 | 13 | 7 | 1 | 2 | 3 | 1 | 1 | |||
| 17. Kansas City | 200 | 200 | 21 | 124 | 3 | 121 | 44 | 49 | 65 | 9 | 4 | 19 | 4 | 1 | 3 | 1 | 1 | ||||
| 18. Minneapolis | 119 | 119 | 20 | 75 | 2 | 50 | 48 | 33 | 13 | 9 | 3 | 3 | 7 | 1 | 2 | ||||||
| 19. Seattle | 155 | 155 | 13 | 118 | 1 | 51 | 88 | 26 | 20 | 5 | 4 | 7 | 3 | 1 | 1 | ||||||
| 20. San Francisco | 249 | 249 | 16 | 181 | 3 | 147 | 77 | 48 | 95 | 5 | 1 | 10 | 8 | 2 | 2 | 1 | |||||
| 21. Los Angeles | 406 | 406 | 44 | 170 | 5 | 171 | 120 | 129 | 28 | 11 | 8 | 80 | 19 | 2 | 6 | 3 | |||||
| 22. Denver | 110 | 110 | 9 | 75 | 3 | 33 | 60 | 23 | 10 | 2 | 6 | 6 | 2 | 1 | |||||||
| Total | 4,618 | 4,618 | 543 | 3,012 | 74 | 1,776 | 2,008 | 954 | 668 | 183 | 87 | 379 | 205 | 7 | 60 | 54 | 1 | 6 | 4 | 2 | |
- 1 Cases in which the Board assumed original jurisdiction.
365 of 365 figures sit in a row or column sum that works out.
Reader’s notes
p. 38. 22 columns: stub, \"Number of unfair labor practice cases received\", five columns under \"Number of charges involving subsections of section 8\" (1-5), and fifteen columns under \"Number of charges by subsections of section 8 involved\" (1 and 3; 1 and 5; 1, 3, and 5; 1, 2, and 3; 1, 2, 3, and 5; 1; 1 and 2; 1 and 4; 1, 2, and 5; 1, 3, and 4; 1, 4, and 5; 1, 2, and 4; 1, 2, 3, and 4; 1, 3, 4, and 5; 1, 2, 3, 4, and 5). The stub has no printed heading. Note that a bare \"1\" appears as a column label in BOTH heading groups (column 3 and column 13 of the grid).\n\nDash rules (\"------\") and blanks are both rendered as \"\". The scan is a coarse 1-bit image and many single-digit cells sit far from their column rules, so I verified the whole grid against the table's internal arithmetic: for every region the fifteen combination columns sum to that region's case total, and the counts of combinations containing subsection 2, 3, 4 and 5 reproduce the printed columns 2, 3, 4 and 5. All 24 row checks and all 21 column totals reconcile exactly with the grid as transcribed. Specific resolutions:\n\n- Degraded final digits. Five cells render in this scan as if ending in 0 (or with an unclear middle digit) but are required by two independent checks each to be a 9/2: Buffalo column \"3\" = 49 (looks like \"40\"); Milwaukee column \"5\" = 79 (looks like \"70\"); San Francisco column \"1\" of the first group = 249 (looks like \"240\"; this column is identical to the cases-received column in every other row); New York column \"1\" of the first group = 729 (looks like \"719\"); Total row, breakdown column \"1\" = 379 (looks like \"370\"). The 379 is confirmed twice over: the 22 regional entries in that column sum to 379, and the fifteen breakdown column totals must sum to the printed grand total 4,618, which requires 379. If you need the literal ink rather than the intended figures, these five are the cells to re-inspect at full resolution.\n- Board^1 row: the row shows four 1's across the breakdown panel. The fourth one is placed in \"1, 2, and 5\". This is forced by the row's own left panel (subsection 2 count = 1 and subsection 5 count = 3 both require a combination containing 2 and 5, while subsection 3 = 2 and subsection 4 = blank exclude the alternatives) and by that column's printed total of 60, which the 22 regions alone reach only 59 of.\n- Pittsburgh row: its single trailing \"2\" is placed in \"1, 3, and 4\", not \"1, 2, and 5\"; this is what makes the row's subsection 2/3/4/5 counts (16/96/2/16) come out right, and both column totals (60 and 54) then close exactly.\n- St. Louis row: \"3\" is placed in \"1, 2, and 5\" and \"1, 3, and 4\" is left empty. The printed engraving looks as though it could carry a second \"3\" one column to the right, but a value there would break the row total (77), the subsection 3 count (60) and both column totals; this is the single cell in the table I am least sure of.\n\nA faint mark sits just above the \"Number of unfair labor practice cases received\" heading. It is most likely a speck rather than a footnote reference (there is no corresponding footnote), so it has not been transcribed.
Source image
Source data: U.S. NLRB Annual Reports (public domain). Reconstruction by NLRB Stats Archive. Read by claude-opus-5 (effort max, prompt extract_v1) from the 300-dpi scan; stitched by page. Updated October 2026.