NLRB Stats Archive › Annual Reports › FY1939 › Analysis of charges pending as of June 30, 1938
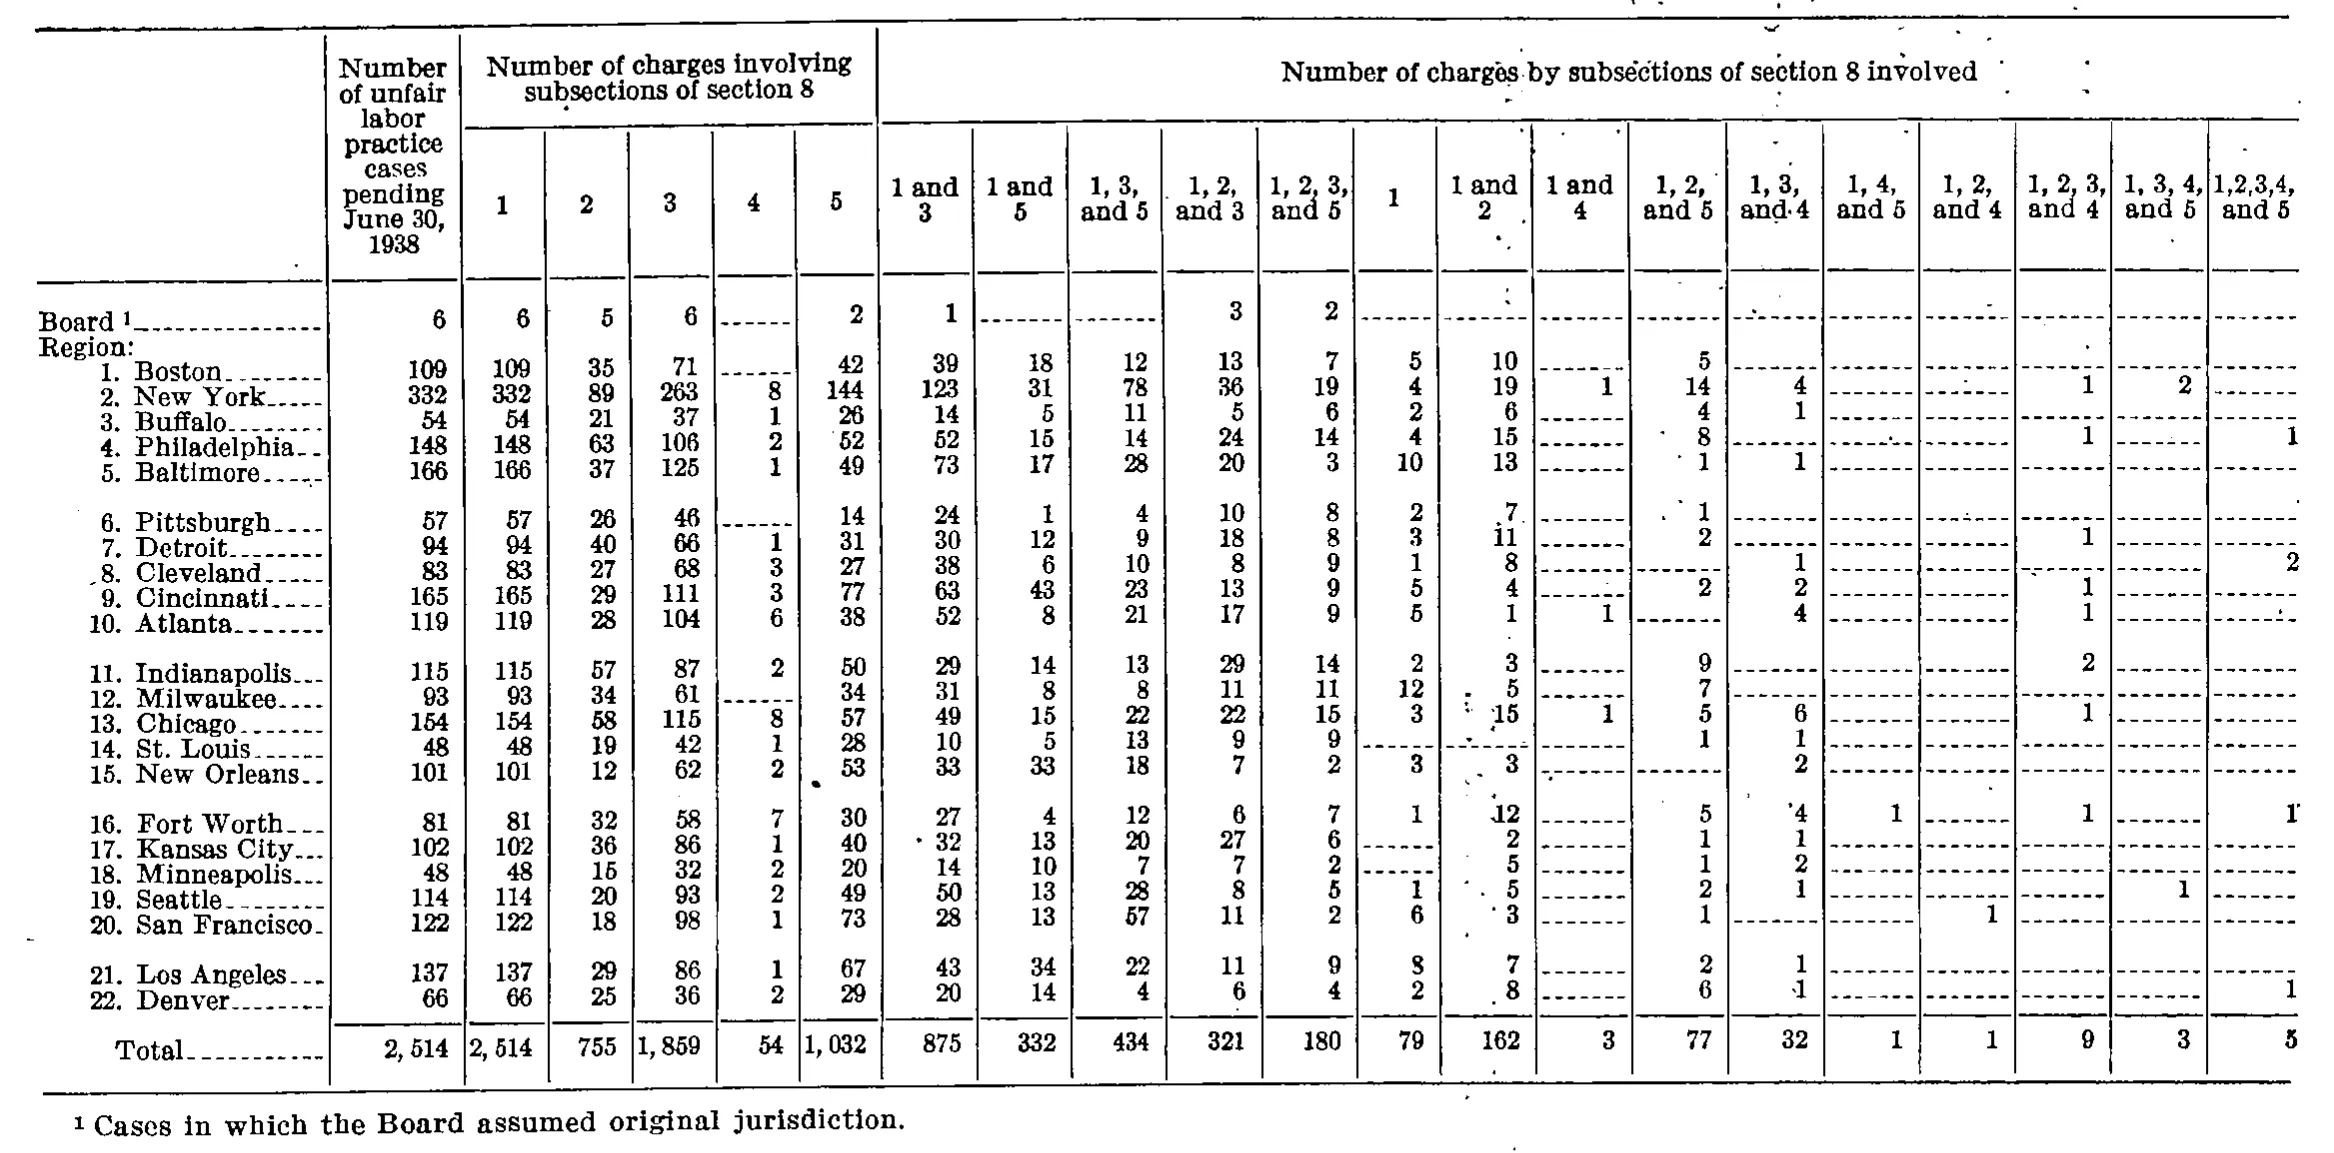
Analysis of charges pending as of June 30, 1938
| Number of unfair labor practice cases pending June 30, 1938 | Number of charges involving subsections of section 8 | Number of charges by subsections of section 8 involved | |||||||||||||||||||
|---|---|---|---|---|---|---|---|---|---|---|---|---|---|---|---|---|---|---|---|---|---|
| Number of unfair labor practice cases pending June 30, 1938 | 1 | 2 | 3 | 4 | 5 | 1 and 3 | 1 and 5 | 1, 3, and 5 | 1, 2, and 3 | 1, 2, 3, and 5 | 1 | 1 and 2 | 1 and 4 | 1, 2, and 5 | 1, 3, and 4 | 1, 4, and 5 | 1, 2, and 4 | 1, 2, 3, and 4 | 1, 3, 4, and 5 | 1,2,3,4, and 5 | |
| Board | 6 | 6 | 5 | 6 | 2 | 1 | 3 | 2 | |||||||||||||
| Region: | |||||||||||||||||||||
| 1. Boston | 109 | 109 | 35 | 71 | 42 | 39 | 18 | 12 | 13 | 7 | 5 | 10 | 5 | ||||||||
| 2. New York | 332 | 332 | 89 | 263 | 8 | 144 | 123 | 31 | 78 | 36 | 19 | 4 | 19 | 1 | 14 | 4 | 1 | 2 | |||
| 3. Buffalo | 54 | 54 | 21 | 37 | 1 | 26 | 14 | 5 | 11 | 5 | 6 | 2 | 6 | 4 | 1 | ||||||
| 4. Philadelphia | 148 | 148 | 63 | 106 | 2 | 52 | 52 | 15 | 14 | 24 | 14 | 4 | 15 | 8 | 1 | 1 | |||||
| 5. Baltimore | 166 | 166 | 37 | 125 | 1 | 49 | 73 | 17 | 28 | 20 | 3 | 10 | 13 | 1 | 1 | ||||||
| 6. Pittsburgh | 57 | 57 | 26 | 46 | 14 | 24 | 1 | 4 | 10 | 8 | 2 | 7 | 1 | ||||||||
| 7. Detroit | 94 | 94 | 40 | 66 | 1 | 31 | 30 | 12 | 9 | 18 | 8 | 3 | 11 | 2 | 1 | ||||||
| 8. Cleveland | 83 | 83 | 27 | 68 | 3 | 27 | 38 | 6 | 10 | 8 | 9 | 1 | 8 | 1 | 2 | ||||||
| 9. Cincinnati | 165 | 165 | 29 | 111 | 3 | 77 | 63 | 43 | 23 | 13 | 9 | 5 | 4 | 2 | 2 | 1 | |||||
| 10. Atlanta | 119 | 119 | 28 | 104 | 6 | 38 | 52 | 8 | 21 | 17 | 9 | 5 | 1 | 1 | 4 | 1 | |||||
| 11. Indianapolis | 115 | 115 | 57 | 87 | 2 | 50 | 29 | 14 | 13 | 29 | 14 | 2 | 3 | 9 | 2 | ||||||
| 12. Milwaukee | 93 | 93 | 34 | 61 | 34 | 31 | 8 | 8 | 11 | 11 | 12 | 5 | 7 | ||||||||
| 13. Chicago | 154 | 154 | 58 | 115 | 8 | 57 | 49 | 15 | 22 | 22 | 15 | 3 | 15 | 1 | 5 | 6 | 1 | ||||
| 14. St. Louis | 48 | 48 | 19 | 42 | 1 | 28 | 10 | 5 | 13 | 9 | 9 | 1 | 1 | ||||||||
| 15. New Orleans | 101 | 101 | 12 | 62 | 2 | 53 | 33 | 33 | 18 | 7 | 2 | 3 | 3 | 2 | |||||||
| 16. Fort Worth | 81 | 81 | 32 | 58 | 7 | 30 | 27 | 4 | 12 | 6 | 7 | 1 | 12 | 5 | 4 | 1 | 1 | 1 | |||
| 17. Kansas City | 102 | 102 | 36 | 86 | 1 | 40 | 32 | 13 | 20 | 27 | 6 | 2 | 1 | 1 | |||||||
| 18. Minneapolis | 48 | 48 | 15 | 32 | 2 | 20 | 14 | 10 | 7 | 7 | 2 | 5 | 1 | 2 | |||||||
| 19. Seattle | 114 | 114 | 20 | 93 | 2 | 49 | 50 | 13 | 28 | 8 | 5 | 1 | 5 | 2 | 1 | 1 | |||||
| 20. San Francisco | 122 | 122 | 18 | 98 | 1 | 73 | 28 | 13 | 57 | 11 | 2 | 6 | 3 | 1 | 1 | ||||||
| 21. Los Angeles | 137 | 137 | 29 | 86 | 1 | 67 | 43 | 34 | 22 | 11 | 9 | 8 | 7 | 2 | 1 | ||||||
| 22. Denver | 66 | 66 | 25 | 36 | 2 | 29 | 20 | 14 | 4 | 6 | 4 | 2 | 8 | 6 | 1 | 1 | |||||
| Total | 2,514 | 2,514 | 755 | 1,859 | 54 | 1,032 | 875 | 332 | 434 | 321 | 180 | 79 | 162 | 3 | 77 | 32 | 1 | 1 | 9 | 3 | 5 |
- 1 Cases in which the Board assumed original jurisdiction.
361 of 361 figures sit in a row or column sum that works out.
Reader’s notes
p. 37. Grid is 22 columns: stub, "Number of unfair labor practice cases pending June 30, 1938" (a tall single heading, repeated in both heading levels), 5 columns under "Number of charges involving subsections of section 8", and 15 columns under "Number of charges by subsections of section 8 involved". No stub heading is printed, so cell 0 of both heading rows is empty. The last spanner column is printed tightly as "1,2,3,4, and 5" and is transcribed that way. Cells printed as a dash rule are transcribed as "". Column placement in the wide right-hand block was the main difficulty: most entries there are isolated one- or two-digit figures separated by long dash rules, and the printed columns are narrow. Every placement was cross-checked against (a) the row's own subsection counts in the "1"-"5" columns, since each combination column contributes to exactly the subsections it names, and (b) the printed column totals. All 21 column totals reproduce exactly as printed with the grid above, and every row's combination cells sum to that row's pending-case figure, so the transcription is internally consistent. Placements resolved this way (where my direct read of the column was uncertain): Cleveland has "1, 3, and 4" = 1 and "1,2,3,4, and 5" = 2 with "1, 2, and 5" empty; Atlanta has "1, 3, and 4" = 4 with "1, 2, and 5" empty; New Orleans has "1, 3, and 4" = 2 with "1, 2, and 5" empty; New York has "1, 2, 3, and 4" = 1 and "1, 3, 4, and 5" = 2 with the last column empty; Philadelphia has "1, 2, 3, and 4" = 1 and "1,2,3,4, and 5" = 1; Denver has "1, 3, and 4" = 1 and "1,2,3,4, and 5" = 1; San Francisco has "1, 2, and 4" = 1 (the only entry in that column). Doubtful digit: row "20. San Francisco", column "1, 2, 3, and 5". The glyph is small and could be read as 5 or as 2; it is transcribed as 2 because the printed column total (180) and that row's own subsection-2, -3 and -5 counts (18, 98, 73) all require 2, and 5 makes the row exceed its 122 pending cases. This is the one cell where the digit itself, not merely its column, was in doubt. No misprints were detected; all printed totals agree with the body as transcribed.
Source image
Source data: U.S. NLRB Annual Reports (public domain). Reconstruction by NLRB Stats Archive. Read by claude-opus-5 (effort max, prompt extract_v1) from the 300-dpi scan; stitched by page. Updated October 2026.