NLRB Stats Archive › Annual Reports › FY1938 › Comparison of number of workers involved in cases brought before the National Labor Relations Board and number of workers involved in strikes, beginning in each month, for all causes and for organization, October 1935–June, 1938
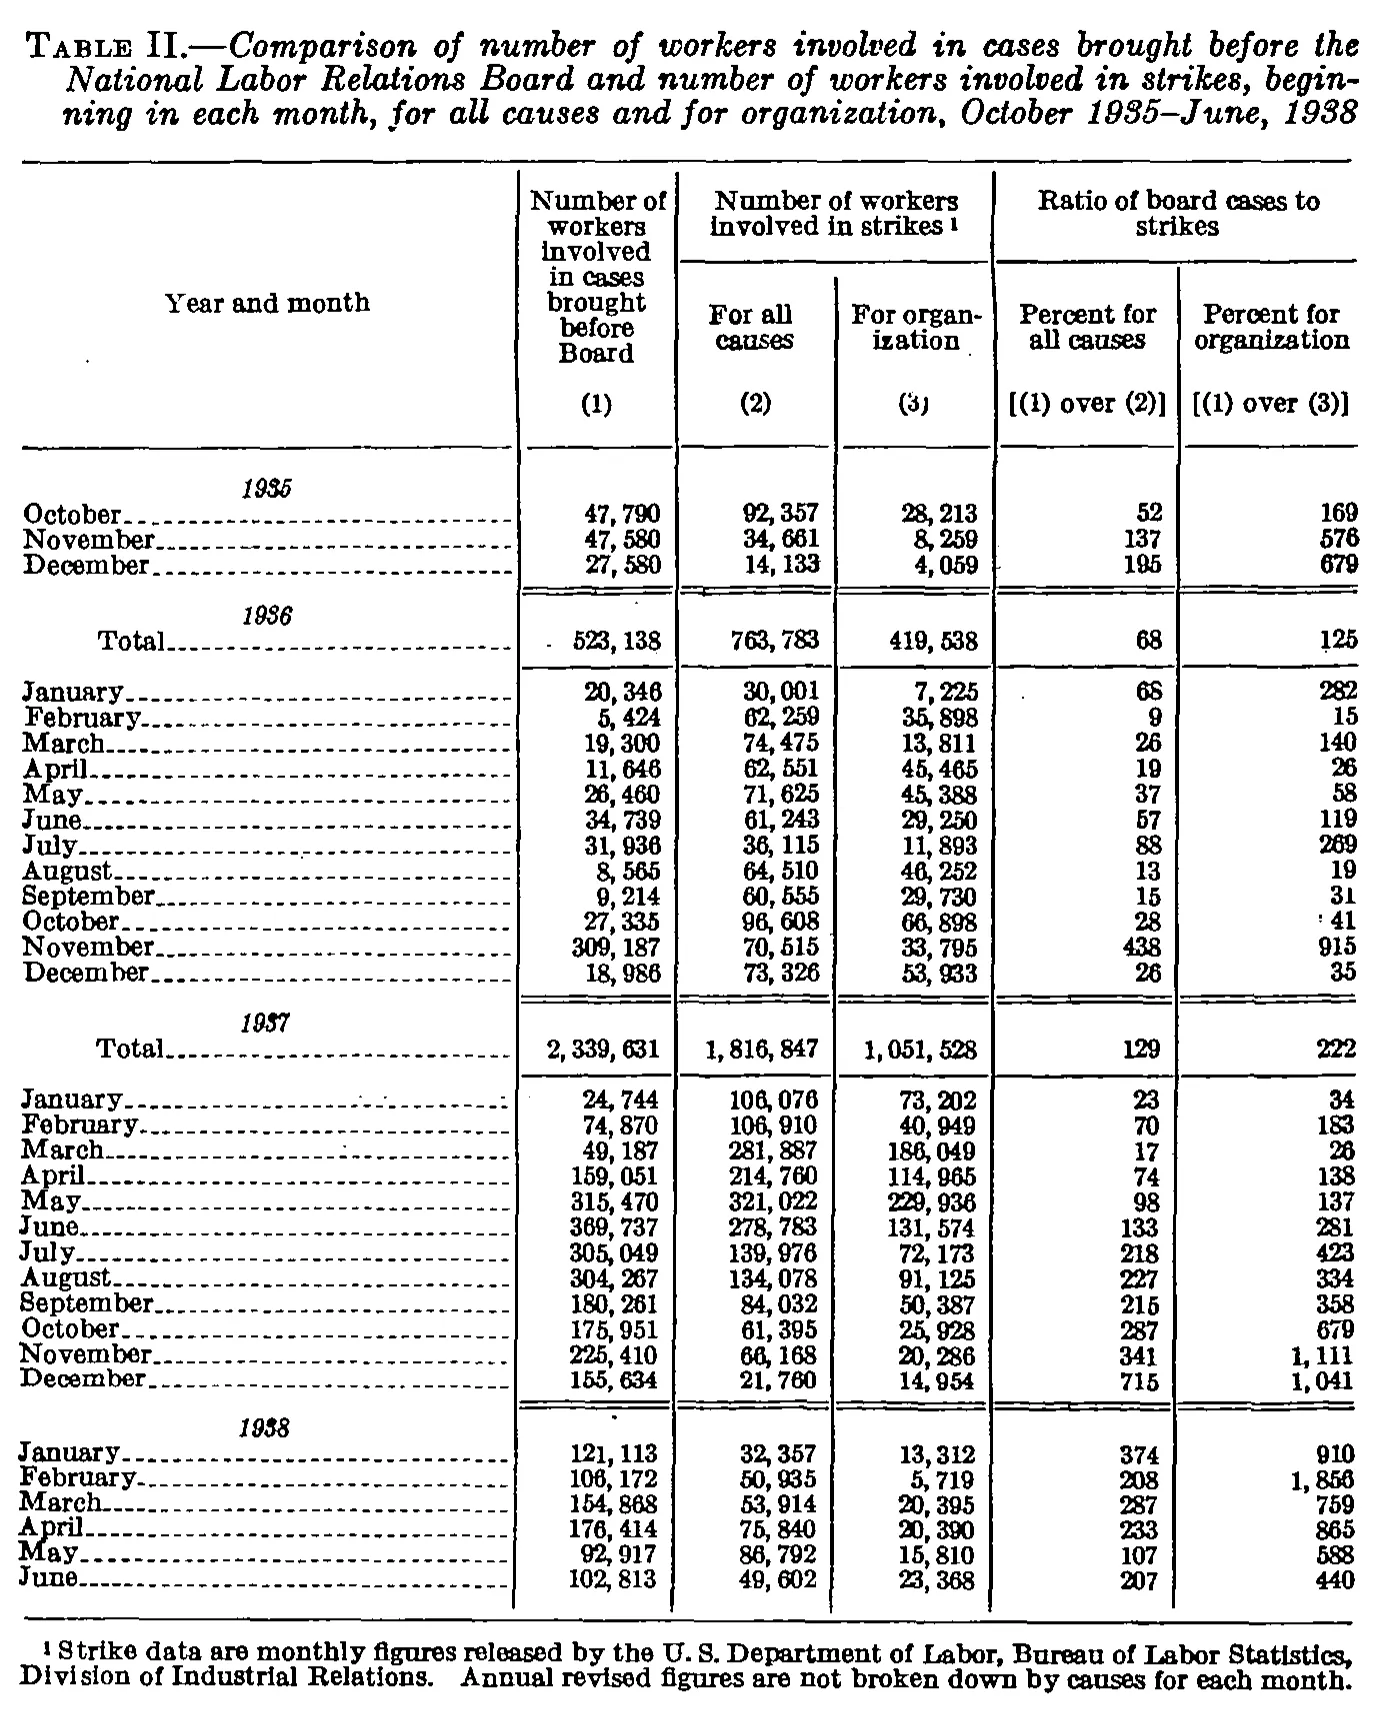
Comparison of number of workers involved in cases brought before the National Labor Relations Board and number of workers involved in strikes, beginning in each month, for all causes and for organization, October 1935–June, 1938
| Year and month | Number of workers involved in cases brought before Board | Number of workers involved in strikes | Ratio of board cases to strikes | ||
|---|---|---|---|---|---|
| Year and month | Number of workers involved in cases brought before Board | For all causes | For organization | Percent for all causes | Percent for organization |
| Year and month | [1] | [2] | [3] | [(1) over (2)] | [(1) over (3)] |
| 1935 | |||||
| October | 47,790 | 92,357 | 28,213 | 52 | 169 |
| November | 47,580 | 34,661 | 8,259 | 137 | 576 |
| December | 27,580 | 14,133 | 4,059 | 195 | 679 |
| 1936 | |||||
| Total | 523,138 | 763,783 | 419,538 | 68 | 125 |
| January | 20,346 | 30,001 | 7,225 | 68 | 282 |
| February | 5,424 | 62,259 | 35,898 | 9 | 15 |
| March | 19,300 | 74,475 | 13,811 | 26 | 140 |
| April | 11,646 | 62,551 | 45,465 | 19 | 26 |
| May | 26,460 | 71,625 | 45,388 | 37 | 58 |
| June | 34,739 | 61,243 | 29,250 | 57 | 119 |
| July | 31,936 | 36,115 | 11,893 | 88 | 269 |
| August | 8,565 | 64,510 | 46,252 | 13 | 19 |
| September | 9,214 | 60,555 | 29,730 | 15 | 31 |
| October | 27,335 | 96,608 | 66,898 | 28 | 41 |
| November | 309,187 | 70,515 | 33,795 | 438 | 915 |
| December | 18,986 | 73,326 | 53,933 | 26 | 35 |
| 1937 | |||||
| Total | 2,339,631 | 1,816,847 | 1,051,528 | 129 | 222 |
| January | 24,744 | 106,076 | 73,202 | 23 | 34 |
| February | 74,870 | 106,910 | 40,949 | 70 | 183 |
| March | 49,187 | 281,887 | 186,049 | 17 | 26 |
| April | 159,051 | 214,760 | 114,965 | 74 | 138 |
| May | 315,470 | 321,022 | 229,936 | 98 | 137 |
| June | 369,737 | 278,783 | 131,574 | 133 | 281 |
| July | 305,049 | 139,976 | 72,173 | 218 | 423 |
| August | 304,267 | 134,078 | 91,125 | 227 | 334 |
| September | 180,261 | 84,032 | 50,387 | 215 | 358 |
| October | 175,951 | 61,395 | 25,928 | 287 | 679 |
| November | 225,410 | 66,168 | 20,286 | 341 | 1,111 |
| December | 155,634 | 21,760 | 14,954 | 715 | 1,041 |
| 1938 | |||||
| January | 121,113 | 32,357 | 13,312 | 374 | 910 |
| February | 106,172 | 50,935 | 5,719 | 208 | 1,856 |
| March | 154,868 | 53,914 | 20,395 | 287 | 759 |
| April | 176,414 | 75,840 | 20,390 | 233 | 865 |
| May | 92,917 | 86,792 | 15,810 | 107 | 588 |
| June | 102,813 | 49,602 | 23,368 | 207 | 440 |
- 1 Strike data are monthly figures released by the U. S. Department of Labor, Bureau of Labor Statistics, Division of Industrial Relations. Annual revised figures are not broken down by causes for each month.
78 of 105 figures sit in a row or column sum that works out.
Reader’s notes
p. 294. Six columns: stub plus five data columns, separated by full-height rules; the "(1)/(2)/(3)" line is treated as a third heading level, with the tall column-1 heading and the stub heading repeated down the levels. Layout of the year blocks: each italic year label ("1935", "1936", "1937", "1938") is printed on its own line as a section line with no values, and where a "Total" row follows immediately under the year label it is the annual total for that same year, printed above that year's twelve monthly rows (verified: the 1936 and 1937 monthly figures in columns 1-3 sum exactly to the "Total" rows printed under "1936" and "1937"). No Total row is printed for 1935 (October-December only) or for 1938 (January-June only); those rows are transcribed as printed. Stray ink, not transcribed as content: a small mark resembling a leader dot sits just left of "523,138" in the 1936 Total row, column 1; a similar speck precedes "41" in the October 1936 "Percent for organization" cell and "32,357" in the January 1938 "For all causes" cell. All three are read as the printed number alone. Typographic reading aids: the italic year labels render ambiguously in the scan ("1937" and "1938" can look like "1957"/"1958"), but the sequence and the data make 1937 and 1938 certain. All printed percent figures were checked against the ratio of columns (1) to (2) and (1) to (3) and every one is consistent with the transcribed digits, which independently corroborates the number readings.
Source image
Source data: U.S. NLRB Annual Reports (public domain). Reconstruction by NLRB Stats Archive. Read by claude-opus-5 (effort max, prompt extract_v1) from the 300-dpi scan; stitched by page. Updated October 2026.