NLRB Stats Archive › Annual Reports › FY1938 › Elections won and lost and participation by labor organizations
Elections won and lost and participation by labor organizations
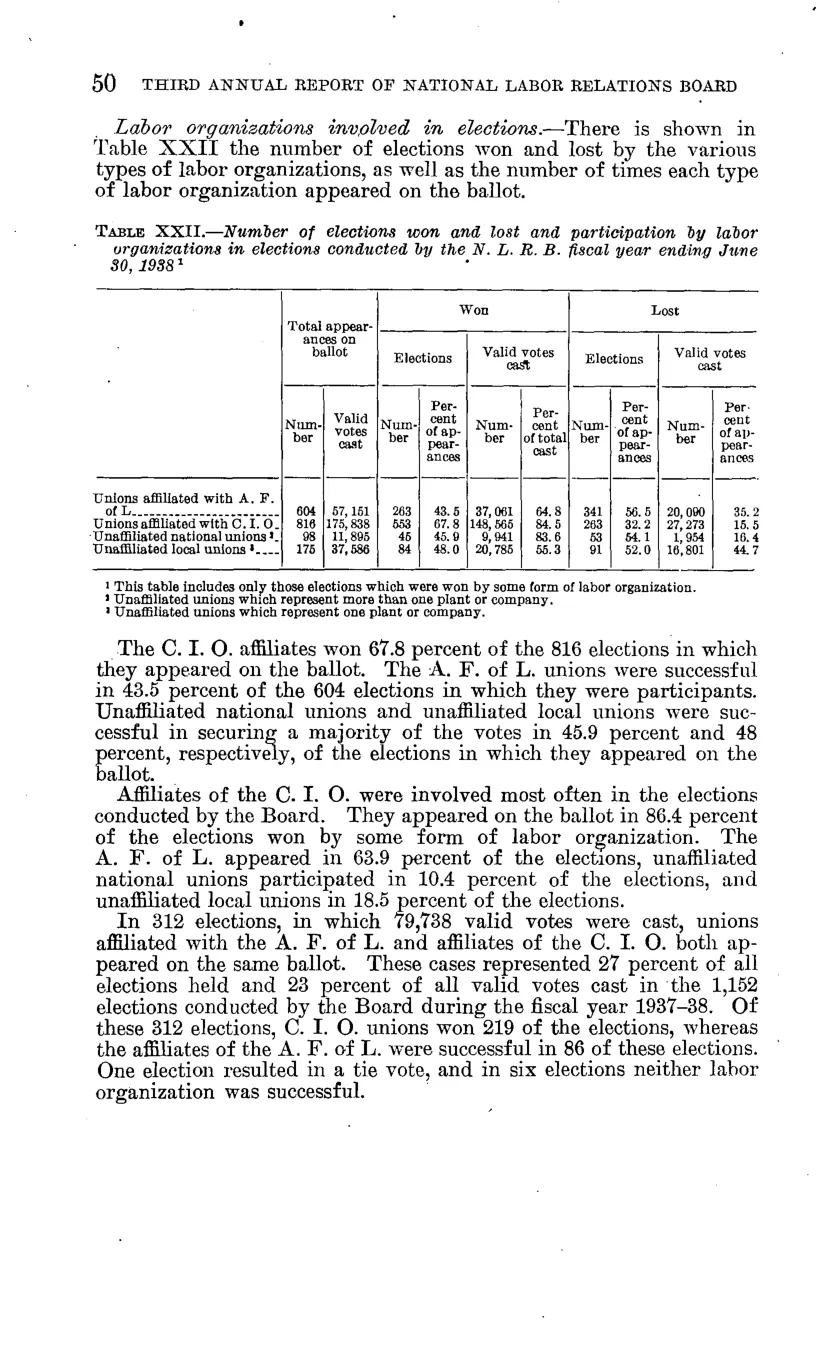
| Total appearances on ballot | Total appearances on ballot | Won | Won | Won | Won | Lost | Lost | Lost | Lost | |
|---|---|---|---|---|---|---|---|---|---|---|
| Total appearances on ballot | Total appearances on ballot | Elections | Elections | Valid votes cast | Valid votes cast | Elections | Elections | Valid votes cast | Valid votes cast | |
| Number | Valid votes cast | Number | Percent of appearances | Number | Percent of total cast | Number | Percent of appearances | Number | Percent of appearances | |
| Unions affiliated with A. F. of L. | 604 | 57,151 | 263 | 43.5 | 37,061 | 64.8 | 341 | 56.5 | 20,090 | 35.2 |
| Unions affiliated with C. I. O. | 816 | 175,838 | 553 | 67.8 | 148,565 | 84.5 | 263 | 32.2 | 27,273 | 15.5 |
| Unaffiliated national unions | 98 | 11,895 | 45 | 45.9 | 9,941 | 83.6 | 53 | 54.1 | 1,954 | 16.4 |
| Unaffiliated local unions | 175 | 37,586 | 84 | 48 | 20,785 | 55.3 | 91 | 52 | 16,801 | 44.7 |
Source image
Source data: U.S. NLRB Annual Reports (public domain). Reconstruction by NLRB Stats Archive. Updated June 2026.