NLRB Stats Archive › Annual Reports › FY1938 › Disposition of representation cases on docket during the fiscal year ending June 30, 1938, by regions
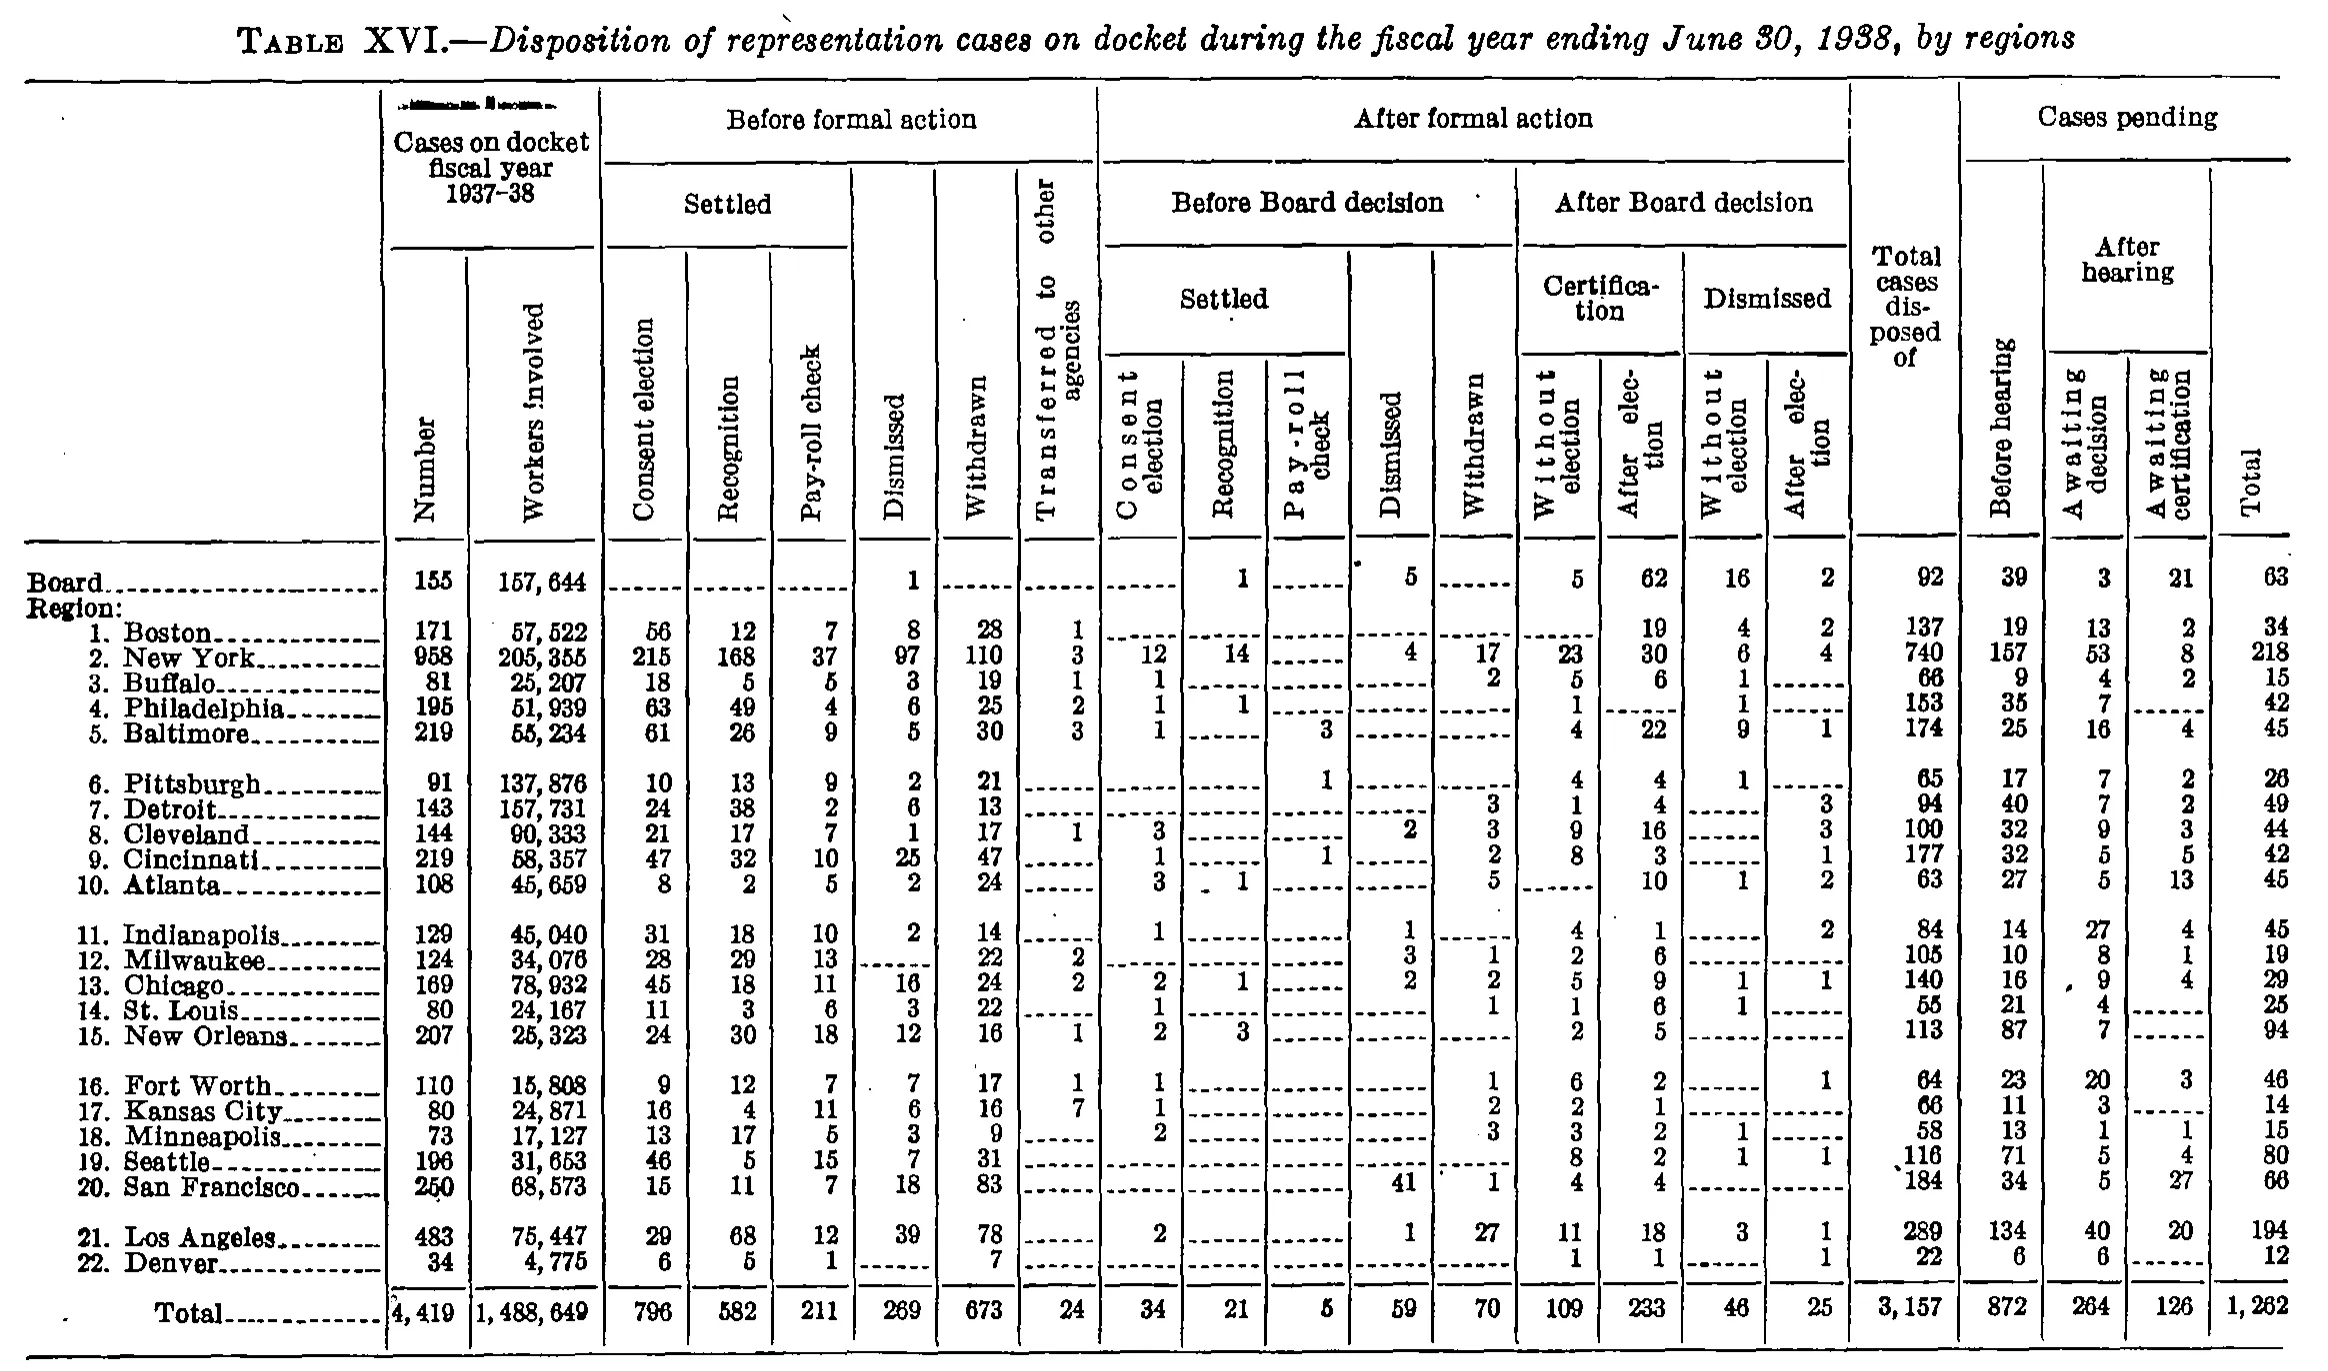
Disposition of representation cases on docket during the fiscal year ending June 30, 1938, by regions
| Cases on docket fiscal year 1937-38 | Before formal action | After formal action | Total cases disposed of | Cases pending | ||||||||||||||||||
|---|---|---|---|---|---|---|---|---|---|---|---|---|---|---|---|---|---|---|---|---|---|---|
| Cases on docket fiscal year 1937-38 | Settled | Dismissed | Withdrawn | Transferred to other agencies | Before Board decision | After Board decision | Total cases disposed of | Before hearing | After hearing | Total | ||||||||||||
| Cases on docket fiscal year 1937-38 | Consent election | Recognition | Pay-roll check | Dismissed | Withdrawn | Transferred to other agencies | Settled | Dismissed | Withdrawn | Certification | Dismissed | Total cases disposed of | Before hearing | Awaiting decision | Awaiting certification | Total | ||||||
| Number | Workers involved | Consent election | Recognition | Pay-roll check | Dismissed | Withdrawn | Transferred to other agencies | Consent election | Recognition | Pay-roll check | Dismissed | Withdrawn | Without election | After election | Without election | After election | Total cases disposed of | Before hearing | Awaiting decision | Awaiting certification | Total | |
| Board | 155 | 157,644 | 1 | 1 | 5 | 5 | 62 | 16 | 2 | 92 | 39 | 3 | 21 | 63 | ||||||||
| Region: | ||||||||||||||||||||||
| 1. Boston | 171 | 57,522 | 56 | 12 | 7 | 8 | 28 | 1 | 19 | 4 | 2 | 137 | 19 | 13 | 2 | 34 | ||||||
| 2. New York | 958 | 205,355 | 215 | 168 | 37 | 97 | 110 | 3 | 12 | 14 | 4 | 17 | 23 | 30 | 6 | 4 | 740 | 157 | 53 | 8 | 218 | |
| 3. Buffalo | 81 | 25,207 | 18 | 5 | 5 | 3 | 19 | 1 | 1 | 2 | 5 | 6 | 1 | 66 | 9 | 4 | 2 | 15 | ||||
| 4. Philadelphia | 195 | 51,939 | 63 | 49 | 4 | 6 | 25 | 2 | 1 | 1 | 1 | 1 | 153 | 35 | 7 | 42 | ||||||
| 5. Baltimore | 219 | 55,234 | 61 | 26 | 9 | 5 | 30 | 3 | 1 | 3 | 4 | 22 | 9 | 1 | 174 | 25 | 16 | 4 | 45 | |||
| 6. Pittsburgh | 91 | 137,876 | 10 | 13 | 9 | 2 | 21 | 1 | 4 | 4 | 1 | 65 | 17 | 7 | 2 | 26 | ||||||
| 7. Detroit | 143 | 157,731 | 24 | 38 | 2 | 6 | 13 | 3 | 1 | 4 | 3 | 94 | 40 | 7 | 2 | 49 | ||||||
| 8. Cleveland | 144 | 90,333 | 21 | 17 | 7 | 1 | 17 | 1 | 3 | 2 | 3 | 9 | 16 | 3 | 100 | 32 | 9 | 3 | 44 | |||
| 9. Cincinnati | 219 | 58,357 | 47 | 32 | 10 | 25 | 47 | 1 | 1 | 2 | 8 | 3 | 1 | 177 | 32 | 5 | 5 | 42 | ||||
| 10. Atlanta | 108 | 45,659 | 8 | 2 | 5 | 2 | 24 | 3 | 1 | 5 | 10 | 1 | 2 | 63 | 27 | 5 | 13 | 45 | ||||
| 11. Indianapolis | 129 | 45,040 | 31 | 18 | 10 | 2 | 14 | 1 | 1 | 4 | 1 | 2 | 84 | 14 | 27 | 4 | 45 | |||||
| 12. Milwaukee | 124 | 34,076 | 28 | 29 | 13 | 22 | 2 | 3 | 1 | 2 | 6 | 105 | 10 | 8 | 1 | 19 | ||||||
| 13. Chicago | 169 | 78,932 | 45 | 18 | 11 | 16 | 24 | 2 | 2 | 1 | 2 | 2 | 5 | 9 | 1 | 1 | 140 | 16 | 9 | 4 | 29 | |
| 14. St. Louis | 80 | 24,167 | 11 | 3 | 6 | 3 | 22 | 1 | 1 | 1 | 6 | 1 | 55 | 21 | 4 | 25 | ||||||
| 15. New Orleans | 207 | 25,323 | 24 | 30 | 18 | 12 | 16 | 1 | 2 | 3 | 2 | 5 | 113 | 87 | 7 | 94 | ||||||
| 16. Fort Worth | 110 | 15,808 | 9 | 12 | 7 | 7 | 17 | 1 | 1 | 1 | 6 | 2 | 1 | 64 | 23 | 20 | 3 | 46 | ||||
| 17. Kansas City | 80 | 24,871 | 16 | 4 | 11 | 6 | 16 | 7 | 1 | 2 | 2 | 1 | 66 | 11 | 3 | 14 | ||||||
| 18. Minneapolis | 73 | 17,127 | 13 | 17 | 5 | 3 | 9 | 2 | 3 | 3 | 2 | 1 | 58 | 13 | 1 | 1 | 15 | |||||
| 19. Seattle | 196 | 31,653 | 46 | 5 | 15 | 7 | 31 | 8 | 2 | 1 | 1 | 116 | 71 | 5 | 4 | 80 | ||||||
| 20. San Francisco | 250 | 68,573 | 15 | 11 | 7 | 18 | 83 | 41 | 1 | 4 | 4 | 184 | 34 | 5 | 27 | 66 | ||||||
| 21. Los Angeles | 483 | 75,447 | 29 | 68 | 12 | 39 | 78 | 2 | 1 | 27 | 11 | 18 | 3 | 1 | 289 | 134 | 40 | 20 | 194 | |||
| 22. Denver | 34 | 4,775 | 6 | 5 | 1 | 7 | 1 | 1 | 1 | 22 | 6 | 6 | 12 | |||||||||
| Total | 4,419 | 1,488,649 | 796 | 582 | 211 | 269 | 673 | 24 | 34 | 21 | 5 | 59 | 70 | 109 | 233 | 46 | 25 | 3,157 | 872 | 264 | 126 | 1,262 |
414 of 414 figures sit in a row or column sum that works out. 2 cells break a sum: '12. Milwaukee', column 19: prints 105, columns 4 to 18 add to 106; '13. Chicago', column 19: prints 140, columns 4 to 18 add to 139.
Reader’s notes
p. 49. 23 columns. The stub column carries no printed heading, so cell 0 of every header row is "". "Region:" is a label-only line (the "Board" line above it carries its own data). Blank cells in the body are printed as leader-dot/dash rules. Verification: all 18 numeric column totals in the "Total" row reconcile exactly with the 23 data rows, and the grand total 3,157 equals both the sum of the "Total cases disposed of" column and the sum of the 15 disposition columns in the Total row. Two exceptions, flagged below. Doubtful cells: 1. "6. Pittsburgh", column "Cases pending / Total": the glyph is degraded in this 1-bit scan and could read 26 or 28. Transcribed as 26 because both checks demand it — the row (17 + 7 + 2 = 26) and the column (the other 22 rows sum to 1,236, and the printed column total is 1,262). If the print really reads 28 it is a misprint. 2. "12. Milwaukee" and "13. Chicago" row totals do not reconcile with their own components, in opposite directions: Milwaukee's entries sum to 106 against a printed 105, Chicago's sum to 139 against a printed 140. The two errors cancel, which is why the column total 3,157 still holds. These are adjacent rows, and the single change that would reconcile both while leaving every column total intact is swapping their values in "After formal action / Before Board decision / Dismissed" (Milwaukee 2, Chicago 3 instead of 3, 2). I have transcribed those two cells as I read them — Milwaukee 3, Chicago 2 — and left the printed row totals 105 and 140 as printed; treat those four cells as the least certain in the grid. Other marks: a smudged struck-through line sits above the "Cases on docket fiscal year 1937-38" heading box and is not readable text; stray specks appear before the "1" in Atlanta's "Before Board decision / Settled / Recognition" cell, before "116" (Seattle) and "184" (San Francisco) in the "Total cases disposed of" column, and above the Board row near the "Before Board decision / Dismissed" rule. None were treated as footnote markers or digits. No footnotes are printed under the table.
Source image
Source data: U.S. NLRB Annual Reports (public domain). Reconstruction by NLRB Stats Archive. Read by claude-opus-5 (effort max, prompt extract_v1) from the 300-dpi scan; stitched by page. Updated October 2026.