NLRB Stats Archive › Annual Reports › FY1938 › Formal action taken by N. L. R. B. in complaint cases on docket during fiscal year ending June 30, 1938, by regions
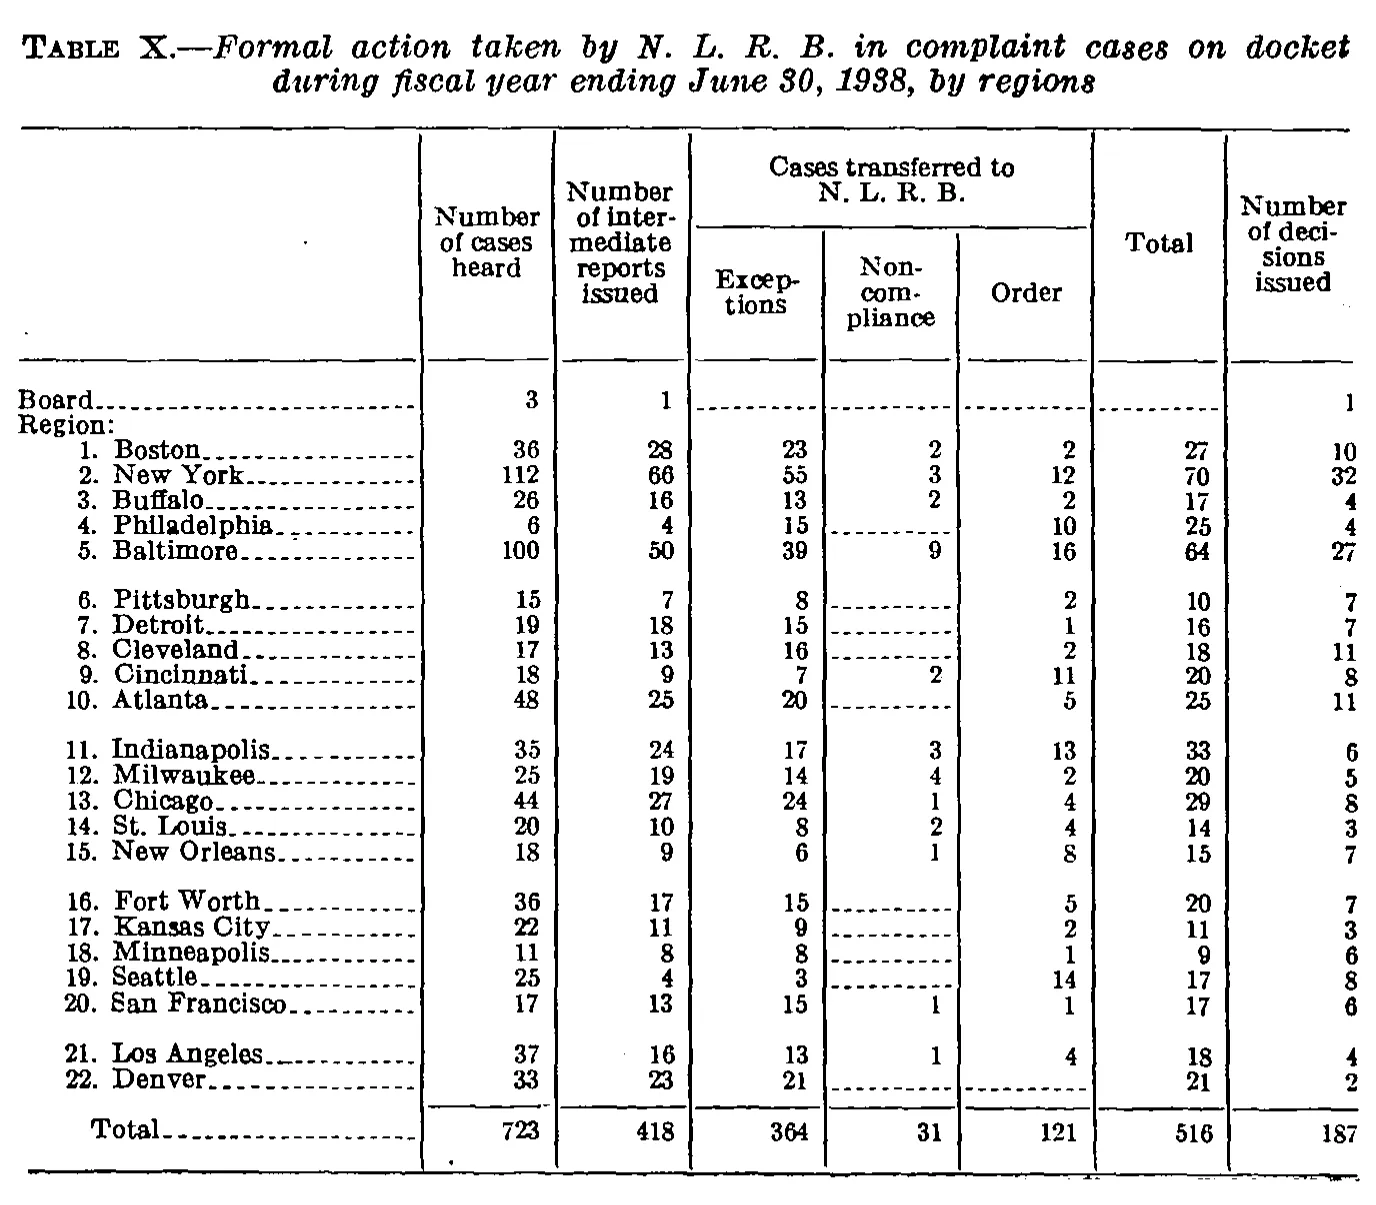
Formal action taken by N. L. R. B. in complaint cases on docket during fiscal year ending June 30, 1938, by regions
| Number of cases heard | Number of intermediate reports issued | Cases transferred to N. L. R. B. | Total | Number of decisions issued | |||
|---|---|---|---|---|---|---|---|
| Number of cases heard | Number of intermediate reports issued | Exceptions | Noncompliance | Order | Total | Number of decisions issued | |
| Board | 3 | 1 | 1 | ||||
| Region: | |||||||
| 1. Boston | 36 | 28 | 23 | 2 | 2 | 27 | 10 |
| 2. New York | 112 | 66 | 55 | 3 | 12 | 70 | 32 |
| 3. Buffalo | 26 | 16 | 13 | 2 | 2 | 17 | 4 |
| 4. Philadelphia | 6 | 4 | 15 | 10 | 25 | 4 | |
| 5. Baltimore | 100 | 50 | 39 | 9 | 16 | 64 | 27 |
| 6. Pittsburgh | 15 | 7 | 8 | 2 | 10 | 7 | |
| 7. Detroit | 19 | 18 | 15 | 1 | 16 | 7 | |
| 8. Cleveland | 17 | 13 | 16 | 2 | 18 | 11 | |
| 9. Cincinnati | 18 | 9 | 7 | 2 | 11 | 20 | 8 |
| 10. Atlanta | 48 | 25 | 20 | 5 | 25 | 11 | |
| 11. Indianapolis | 35 | 24 | 17 | 3 | 13 | 33 | 6 |
| 12. Milwaukee | 25 | 19 | 14 | 4 | 2 | 20 | 5 |
| 13. Chicago | 44 | 27 | 24 | 1 | 4 | 29 | 8 |
| 14. St. Louis | 20 | 10 | 8 | 2 | 4 | 14 | 3 |
| 15. New Orleans | 18 | 9 | 6 | 1 | 8 | 15 | 7 |
| 16. Fort Worth | 36 | 17 | 15 | 5 | 20 | 7 | |
| 17. Kansas City | 22 | 11 | 9 | 2 | 11 | 3 | |
| 18. Minneapolis | 11 | 8 | 8 | 1 | 9 | 6 | |
| 19. Seattle | 25 | 4 | 3 | 14 | 17 | 8 | |
| 20. San Francisco | 17 | 13 | 15 | 1 | 1 | 17 | 6 |
| 21. Los Angeles | 37 | 16 | 13 | 1 | 4 | 18 | 4 |
| 22. Denver | 33 | 23 | 21 | 21 | 2 | ||
| Total | 723 | 418 | 364 | 31 | 121 | 516 | 187 |
153 of 153 figures sit in a row or column sum that works out.
Reader’s notes
p. 40. Eight columns: stub plus seven data columns, with the spanner "Cases transferred to N. L. R. B." covering Exceptions, Non-compliance and Order. The stub has no printed heading (the head cell is blank apart from a stray leader dot). "Number of cases heard", "Number of intermediate reports issued", "Total" and "Number of decisions issued" are tall single headings spanning both heading levels, so they are repeated in both. The Non-compliance heading is printed broken over three lines as "Non- com- pliance"; following the hyphen-repair rule it is joined as "Noncompliance", though the intended form may be the hyphenated "Non-compliance". "Number of deci- sions issued" was likewise joined to "Number of decisions issued". Dash rules ("------") standing for zero/none were transcribed as empty cells: Board (Exceptions, Non-compliance, Order, Total — two rules, one spanning Exceptions+Non-compliance and one spanning Order+Total); Philadelphia, Pittsburgh, Detroit, Cleveland, Atlanta, Fort Worth, Kansas City, Minneapolis, Seattle (Non-compliance); and Denver (Non-compliance and Order). Possible misprint, transcribed as printed: row "4. Philadelphia" shows only 6 cases heard and 4 intermediate reports issued, yet 15 exceptions and 25 cases transferred to the Board. These figures are nonetheless internally consistent with the printed totals, so no correction was made: the Philadelphia entries of 6 and 4 are required for the "Number of cases heard" column to sum to 723 and the "Number of intermediate reports issued" column to sum to 418. Arithmetic checks (for confidence in column placement only; nothing was computed into the grid): Exceptions + Non-compliance + Order equals the printed Total in every one of the 22 region rows, and all seven data columns sum exactly to the printed Total row (723, 418, 364, 31, 121, 516, 187).
Source image
Source data: U.S. NLRB Annual Reports (public domain). Reconstruction by NLRB Stats Archive. Read by claude-opus-5 (effort max, prompt extract_v1) from the 300-dpi scan; stitched by page. Updated October 2026.