NLRB Stats Archive › Annual Reports › FY1938 › Analysis of charges pending as of June 30, 1937
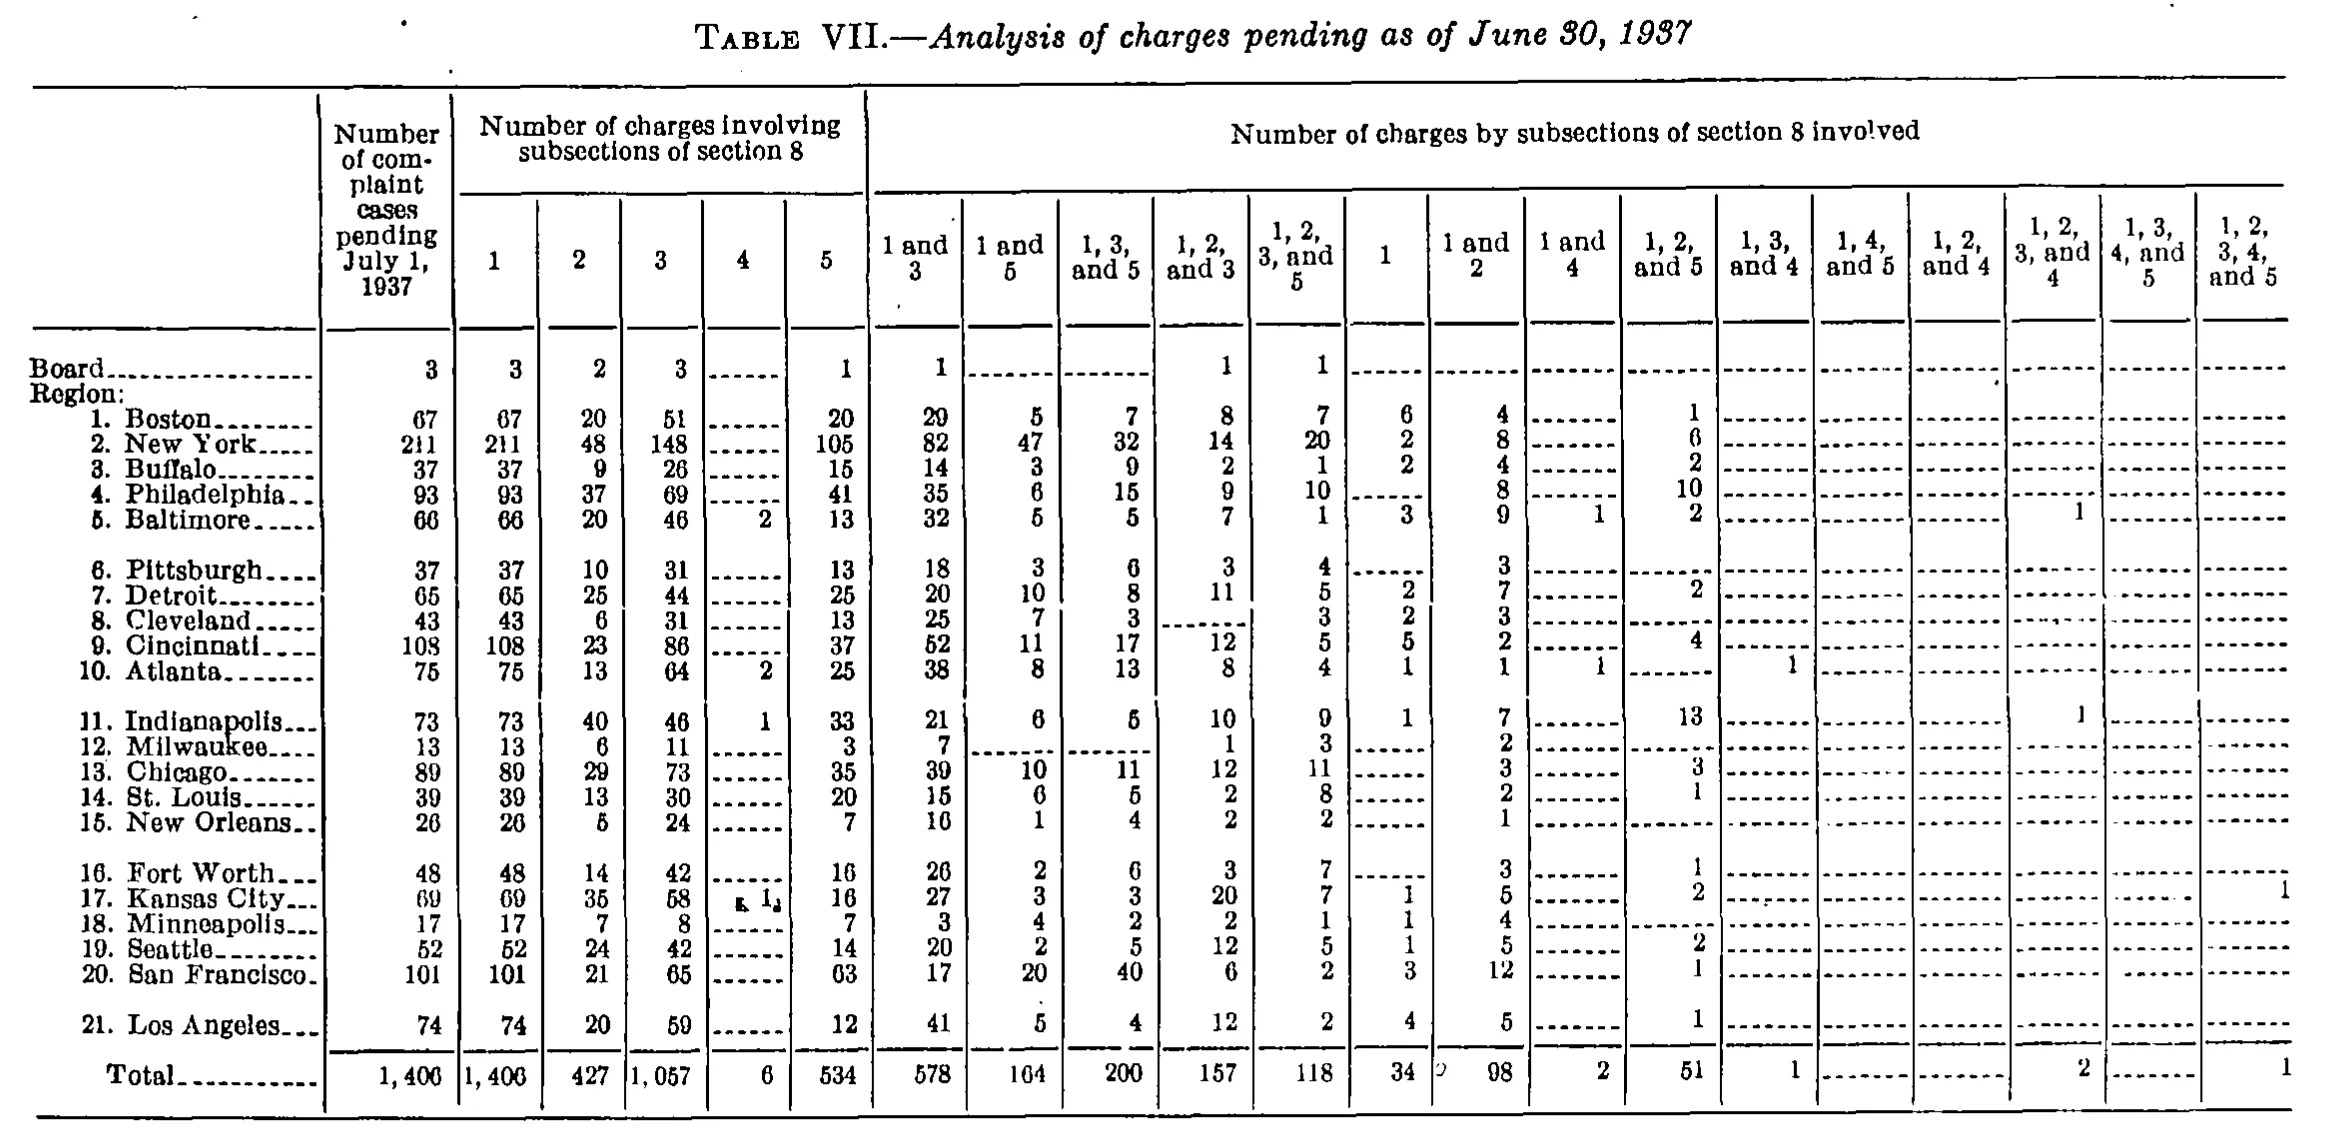
Analysis of charges pending as of June 30, 1937
| Number of complaint cases pending July 1, 1937 | Number of charges involving subsections of section 8 | Number of charges by subsections of section 8 involved | |||||||||||||||||||
|---|---|---|---|---|---|---|---|---|---|---|---|---|---|---|---|---|---|---|---|---|---|
| Number of complaint cases pending July 1, 1937 | 1 | 2 | 3 | 4 | 5 | 1 and 3 | 1 and 5 | 1, 3, and 5 | 1, 2, and 3 | 1, 2, 3, and 5 | 1 | 1 and 2 | 1 and 4 | 1, 2, and 5 | 1, 3, and 4 | 1, 4, and 5 | 1, 2, and 4 | 1, 2, 3, and 4 | 1, 3, 4, and 5 | 1, 2, 3, 4, and 5 | |
| Board | 3 | 3 | 2 | 3 | 1 | 1 | 1 | 1 | |||||||||||||
| Region: | |||||||||||||||||||||
| 1. Boston | 67 | 67 | 20 | 51 | 20 | 29 | 5 | 7 | 8 | 7 | 6 | 4 | 1 | ||||||||
| 2. New York | 211 | 211 | 48 | 148 | 105 | 82 | 47 | 32 | 14 | 20 | 2 | 8 | 6 | ||||||||
| 3. Buffalo | 37 | 37 | 9 | 26 | 15 | 14 | 3 | 9 | 2 | 1 | 2 | 4 | 2 | ||||||||
| 4. Philadelphia | 93 | 93 | 37 | 69 | 41 | 35 | 6 | 15 | 9 | 10 | 8 | 10 | |||||||||
| 5. Baltimore | 66 | 66 | 20 | 46 | 2 | 13 | 32 | 5 | 5 | 7 | 1 | 3 | 9 | 1 | 2 | 1 | |||||
| 6. Pittsburgh | 37 | 37 | 10 | 31 | 13 | 18 | 3 | 6 | 3 | 4 | 3 | ||||||||||
| 7. Detroit | 65 | 65 | 25 | 44 | 25 | 20 | 10 | 8 | 11 | 5 | 2 | 7 | 2 | ||||||||
| 8. Cleveland | 43 | 43 | 6 | 31 | 13 | 25 | 7 | 3 | 3 | 2 | 3 | ||||||||||
| 9. Cincinnati | 108 | 108 | 23 | 86 | 37 | 52 | 11 | 17 | 12 | 5 | 5 | 2 | 4 | ||||||||
| 10. Atlanta | 75 | 75 | 13 | 64 | 2 | 25 | 38 | 8 | 13 | 8 | 4 | 1 | 1 | 1 | 1 | ||||||
| 11. Indianapolis | 73 | 73 | 40 | 46 | 1 | 33 | 21 | 6 | 5 | 10 | 9 | 1 | 7 | 13 | 1 | ||||||
| 12. Milwaukee | 13 | 13 | 6 | 11 | 3 | 7 | 1 | 3 | 2 | ||||||||||||
| 13. Chicago | 89 | 89 | 29 | 73 | 35 | 39 | 10 | 11 | 12 | 11 | 3 | 3 | |||||||||
| 14. St. Louis | 39 | 39 | 13 | 30 | 20 | 15 | 6 | 5 | 2 | 8 | 2 | 1 | |||||||||
| 15. New Orleans | 26 | 26 | 5 | 24 | 7 | 16 | 1 | 4 | 2 | 2 | 1 | ||||||||||
| 16. Fort Worth | 48 | 48 | 14 | 42 | 16 | 26 | 2 | 6 | 3 | 7 | 3 | 1 | |||||||||
| 17. Kansas City | 69 | 69 | 35 | 58 | 1 | 16 | 27 | 3 | 3 | 20 | 7 | 1 | 5 | 2 | 1 | ||||||
| 18. Minneapolis | 17 | 17 | 7 | 8 | 7 | 3 | 4 | 2 | 2 | 1 | 1 | 4 | |||||||||
| 19. Seattle | 52 | 52 | 24 | 42 | 14 | 20 | 2 | 5 | 12 | 5 | 1 | 5 | 2 | ||||||||
| 20. San Francisco | 101 | 101 | 21 | 65 | 63 | 17 | 20 | 40 | 6 | 2 | 3 | 12 | 1 | ||||||||
| 21. Los Angeles | 74 | 74 | 20 | 59 | 12 | 41 | 5 | 4 | 12 | 2 | 4 | 5 | 1 | ||||||||
| Total | 1,406 | 1,406 | 427 | 1,057 | 6 | 534 | 578 | 164 | 200 | 157 | 118 | 34 | 98 | 2 | 51 | 1 | 2 | 1 | |||
293 of 293 figures sit in a row or column sum that works out.
Reader’s notes
p. 36. 22 columns: stub, "Number of complaint cases pending July 1, 1937", five single-subsection columns (1-5), and fifteen combination columns. The stub column has no printed heading, so cell 0 of both heading levels is empty. Print quality: this is a degraded scan in which the bowls of "6" and "9" frequently fill in and read as "0" at the available resolution (e.g. Baltimore's 66, Buffalo's 26, Atlanta's 64, San Francisco's 63, the 164 total). Two cells were genuinely ambiguous and I resolved them against the table's internal arithmetic rather than leaving a likely-wrong digit: - "1. Boston" / "1 and 3": the glyph reads as either 20 or 29. I transcribed 29. Three independent checks require it: Boston's combination cells must sum to its 67 complaint cases (29+5+7+8+7+6+4+1=67), the column must sum to the printed 578, and the subsection-3 identity (29+7+8+7=51) must equal Boston's printed 51. A printed 20 would break all three by exactly 9. - "13. Chicago" / subsection "1": the glyph reads as either 80 or 89. I transcribed 89. The column must sum to the printed 1,406, and in every other row this column equals the complaint-case count (Chicago's is 89, itself confirmed by its combinations summing to 89). Both are judgment calls; a user needing certainty should re-check these two cells at higher resolution. Stray ink, transcribed as the clean value: the Kansas City subsection-4 cell has specks flanking the "1" (value confirmed by the column total of 6); the Total row's "1 and 2" cell has a stray mark at its left edge before 98 (confirmed by the column summing to 98) which appears to be an artifact or a broken column rule, not a footnote marker. The Board row's "1, 3, and 5" cell is blank rather than carrying a dash rule; it is "" either way. All other blank cells are printed as dash rules or leader dots. Every other column reconciles exactly with its printed total, and every row's combination cells sum exactly to that row's complaint-case count, so the column assignment of the numbers is well corroborated. No footnotes are printed under the table.
Source image
Source data: U.S. NLRB Annual Reports (public domain). Reconstruction by NLRB Stats Archive. Read by claude-opus-5 (effort max, prompt extract_v1) from the 300-dpi scan; stitched by page. Updated October 2026.