NLRB Stats Archive › Annual Reports › FY1938 › Analysis of charges received during fiscal year ending June 30, 1938
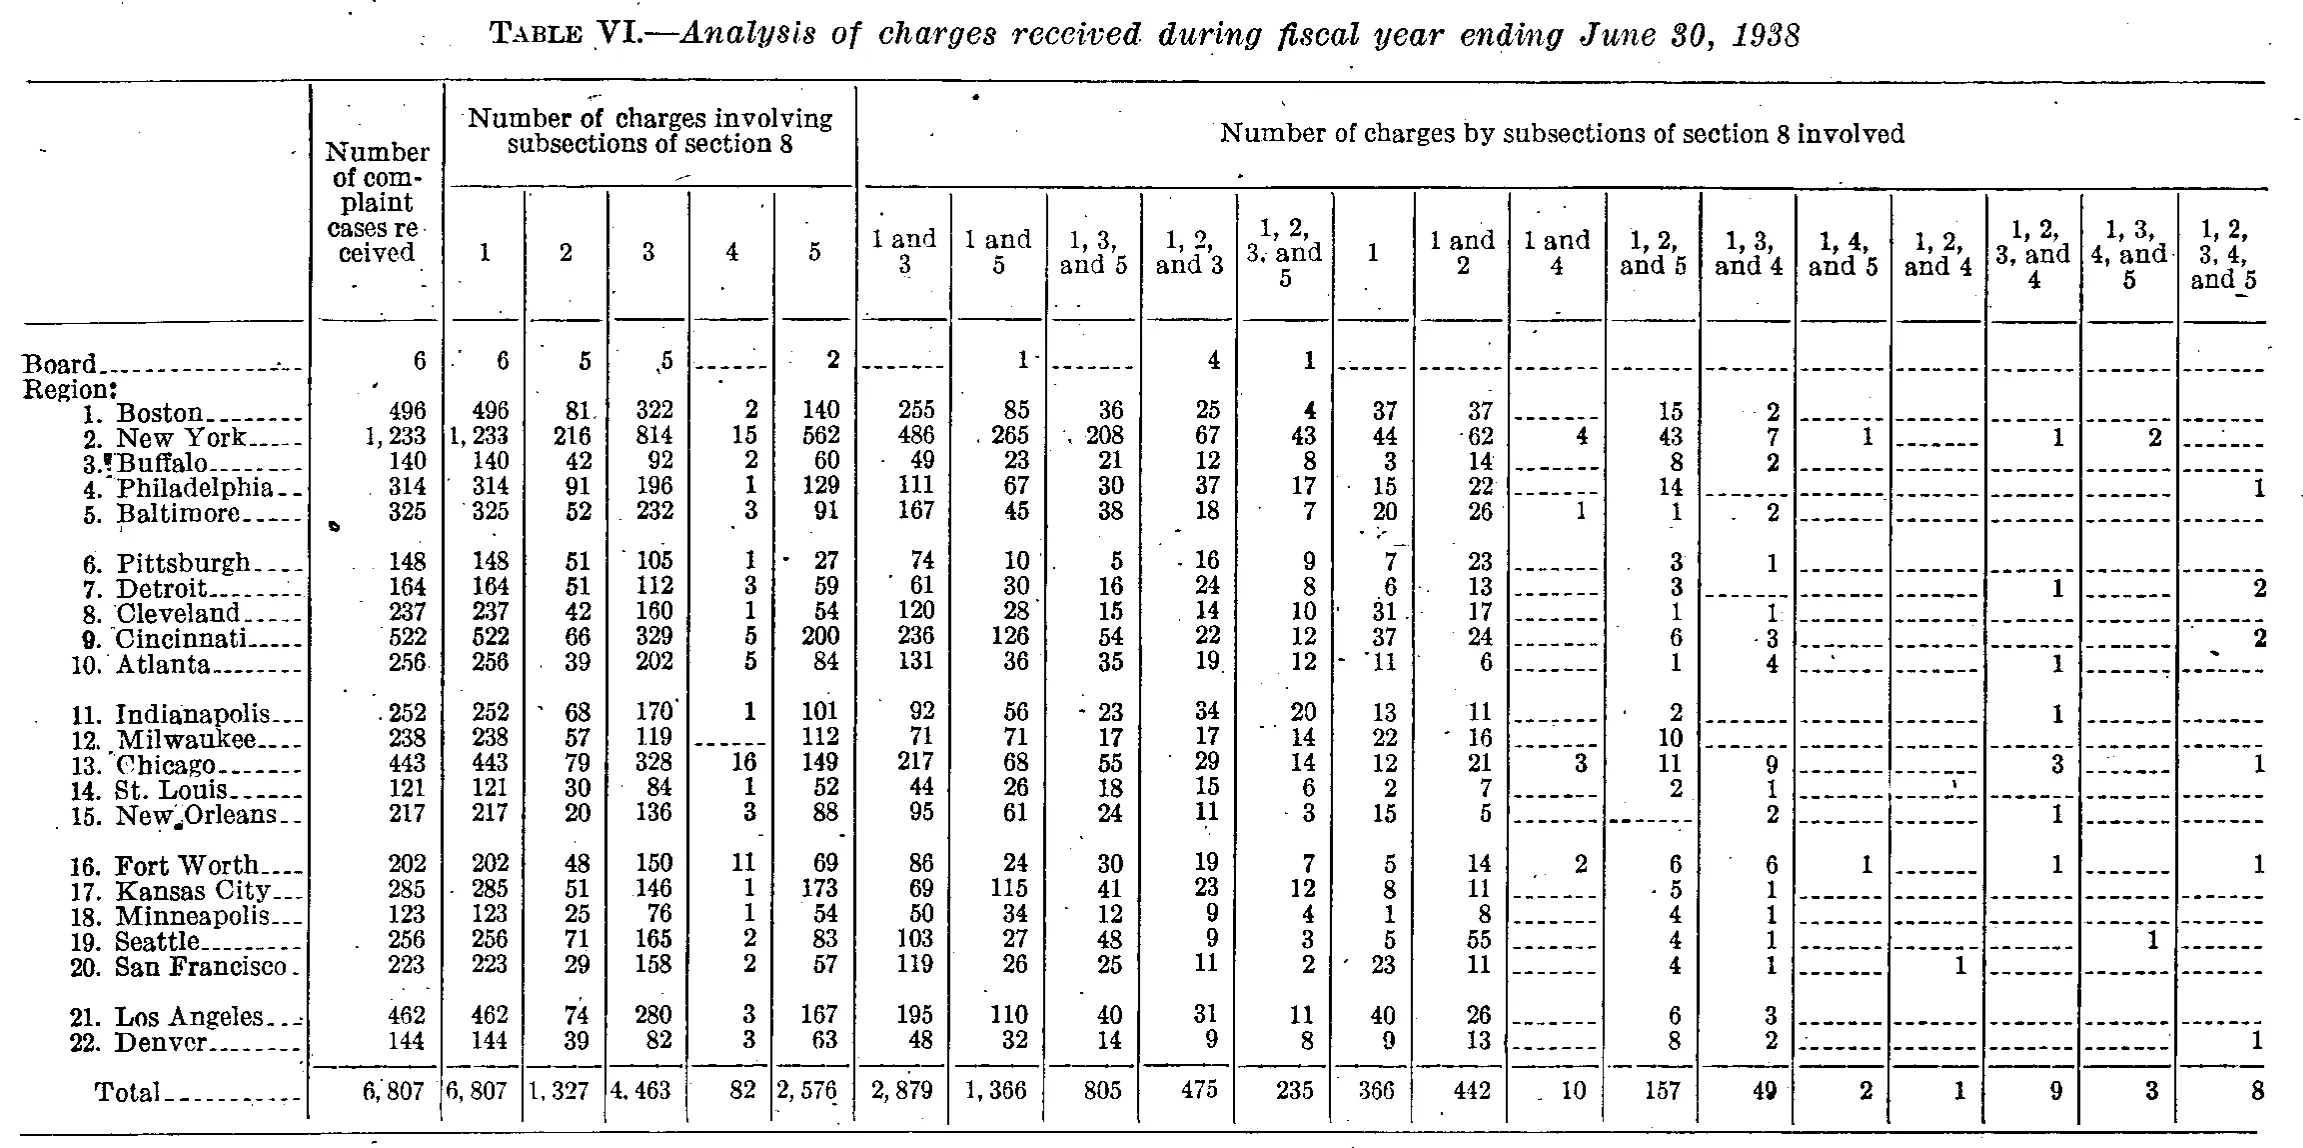
Analysis of charges received during fiscal year ending June 30, 1938
| Number of complaint cases received | Number of charges involving subsections of section 8 | Number of charges by subsections of section 8 involved | |||||||||||||||||||
|---|---|---|---|---|---|---|---|---|---|---|---|---|---|---|---|---|---|---|---|---|---|
| Number of complaint cases received | 1 | 2 | 3 | 4 | 5 | 1 and 3 | 1 and 5 | 1, 3, and 5 | 1, 2, and 3 | 1, 2, 3, and 5 | 1 | 1 and 2 | 1 and 4 | 1, 2, and 5 | 1, 3, and 4 | 1, 4, and 5 | 1, 2, and 4 | 1, 2, 3, and 4 | 1, 3, 4, and 5 | 1, 2, 3, 4, and 5 | |
| Board | 6 | 6 | 5 | 5 | 2 | 1 | 4 | 1 | |||||||||||||
| Region: | |||||||||||||||||||||
| 1. Boston | 496 | 496 | 81 | 322 | 2 | 140 | 255 | 85 | 36 | 25 | 4 | 37 | 37 | 15 | 2 | ||||||
| 2. New York | 1,233 | 1,233 | 216 | 814 | 15 | 562 | 486 | 265 | 208 | 67 | 43 | 44 | 62 | 4 | 43 | 7 | 1 | 1 | 2 | ||
| 3. Buffalo | 140 | 140 | 42 | 92 | 2 | 60 | 49 | 23 | 21 | 12 | 8 | 3 | 14 | 8 | 2 | ||||||
| 4. Philadelphia | 314 | 314 | 91 | 196 | 1 | 129 | 111 | 67 | 30 | 37 | 17 | 15 | 22 | 14 | 1 | ||||||
| 5. Baltimore | 325 | 325 | 52 | 232 | 3 | 91 | 167 | 45 | 38 | 18 | 7 | 20 | 26 | 1 | 1 | 2 | |||||
| 6. Pittsburgh | 148 | 148 | 51 | 105 | 1 | 27 | 74 | 10 | 5 | 16 | 9 | 7 | 23 | 3 | 1 | ||||||
| 7. Detroit | 164 | 164 | 51 | 112 | 3 | 59 | 61 | 30 | 16 | 24 | 8 | 6 | 13 | 3 | 1 | 2 | |||||
| 8. Cleveland | 237 | 237 | 42 | 160 | 1 | 54 | 120 | 28 | 15 | 14 | 10 | 31 | 17 | 1 | 1 | ||||||
| 9. Cincinnati | 522 | 522 | 66 | 329 | 5 | 200 | 236 | 126 | 54 | 22 | 12 | 37 | 24 | 6 | 3 | 2 | |||||
| 10. Atlanta | 256 | 256 | 39 | 202 | 5 | 84 | 131 | 36 | 35 | 19 | 12 | 11 | 6 | 1 | 4 | 1 | |||||
| 11. Indianapolis | 252 | 252 | 68 | 170 | 1 | 101 | 92 | 56 | 23 | 34 | 20 | 13 | 11 | 2 | 1 | ||||||
| 12. Milwaukee | 238 | 238 | 57 | 119 | 112 | 71 | 71 | 17 | 17 | 14 | 22 | 16 | 10 | ||||||||
| 13. Chicago | 443 | 443 | 79 | 328 | 16 | 149 | 217 | 68 | 55 | 29 | 14 | 12 | 21 | 3 | 11 | 9 | 3 | 1 | |||
| 14. St. Louis | 121 | 121 | 30 | 84 | 1 | 52 | 44 | 26 | 18 | 15 | 6 | 2 | 7 | 2 | 1 | ||||||
| 15. New Orleans | 217 | 217 | 20 | 136 | 3 | 88 | 95 | 61 | 24 | 11 | 3 | 15 | 5 | 2 | 1 | ||||||
| 16. Fort Worth | 202 | 202 | 48 | 150 | 11 | 69 | 86 | 24 | 30 | 19 | 7 | 5 | 14 | 2 | 6 | 6 | 1 | 1 | 1 | ||
| 17. Kansas City | 285 | 285 | 51 | 146 | 1 | 173 | 69 | 115 | 41 | 23 | 12 | 8 | 11 | 5 | 1 | ||||||
| 18. Minneapolis | 123 | 123 | 25 | 76 | 1 | 54 | 50 | 34 | 12 | 9 | 4 | 1 | 8 | 4 | 1 | ||||||
| 19. Seattle | 256 | 256 | 71 | 165 | 2 | 83 | 103 | 27 | 48 | 9 | 3 | 5 | 55 | 4 | 1 | 1 | |||||
| 20. San Francisco | 223 | 223 | 29 | 158 | 2 | 57 | 119 | 26 | 25 | 11 | 2 | 23 | 11 | 4 | 1 | 1 | |||||
| 21. Los Angeles | 462 | 462 | 74 | 280 | 3 | 167 | 195 | 110 | 40 | 31 | 11 | 40 | 26 | 6 | 3 | ||||||
| 22. Denver | 144 | 144 | 39 | 82 | 3 | 63 | 48 | 32 | 14 | 9 | 8 | 9 | 13 | 8 | 2 | 1 | |||||
| Total | 6,807 | 6,807 | 1,327 | 4,463 | 82 | 2,576 | 2,879 | 1,366 | 805 | 475 | 235 | 366 | 442 | 10 | 157 | 49 | 2 | 1 | 9 | 3 | 8 |
375 of 375 figures sit in a row or column sum that works out.
Reader’s notes
p. 35. 22 columns: stub, "Number of complaint cases received" (a tall heading spanning both header levels), five columns under "Number of charges involving subsections of section 8" (1-5), and fifteen columns under "Number of charges by subsections of section 8 involved". The stub carries no printed heading, so its header cells are empty. Empty cells in the body are printed as dash rules (------) or are blank; both are transcribed as "". Every numeric column was checked against the printed Total row and all 21 columns reconcile exactly (e.g. 6,807; 1,327; 4,463; 82; 2,576; 2,879; 1,366; 805; 475; 235; 366; 442; 10; 157; 49; 2; 1; 9; 3; 8), so no printed total appears to be in error. Two cells in the narrow right-hand columns are visually close to a column rule and were assigned by that total check: Baltimore's "2" sits in "1, 3, and 4" (not "1, 4, and 5"), and New Orleans's "2" sits in "1, 3, and 4" with its "1, 2, and 5" cell empty. Both placements are the only ones consistent with the printed column totals of 49, 157 and 2. The "Number of complaint cases received" column and the first-group "1" column hold identical values in every row, as printed. "Region:" is a section label with no values. Row labels are indented under it and numbered 1-22 as printed.
Source image
Source data: U.S. NLRB Annual Reports (public domain). Reconstruction by NLRB Stats Archive. Read by claude-opus-5 (effort max, prompt extract_v1) from the 300-dpi scan; stitched by page. Updated October 2026.