NLRB Stats Archive › Annual Reports › FY1937 › Results of elections held by the National Labor Relations Board
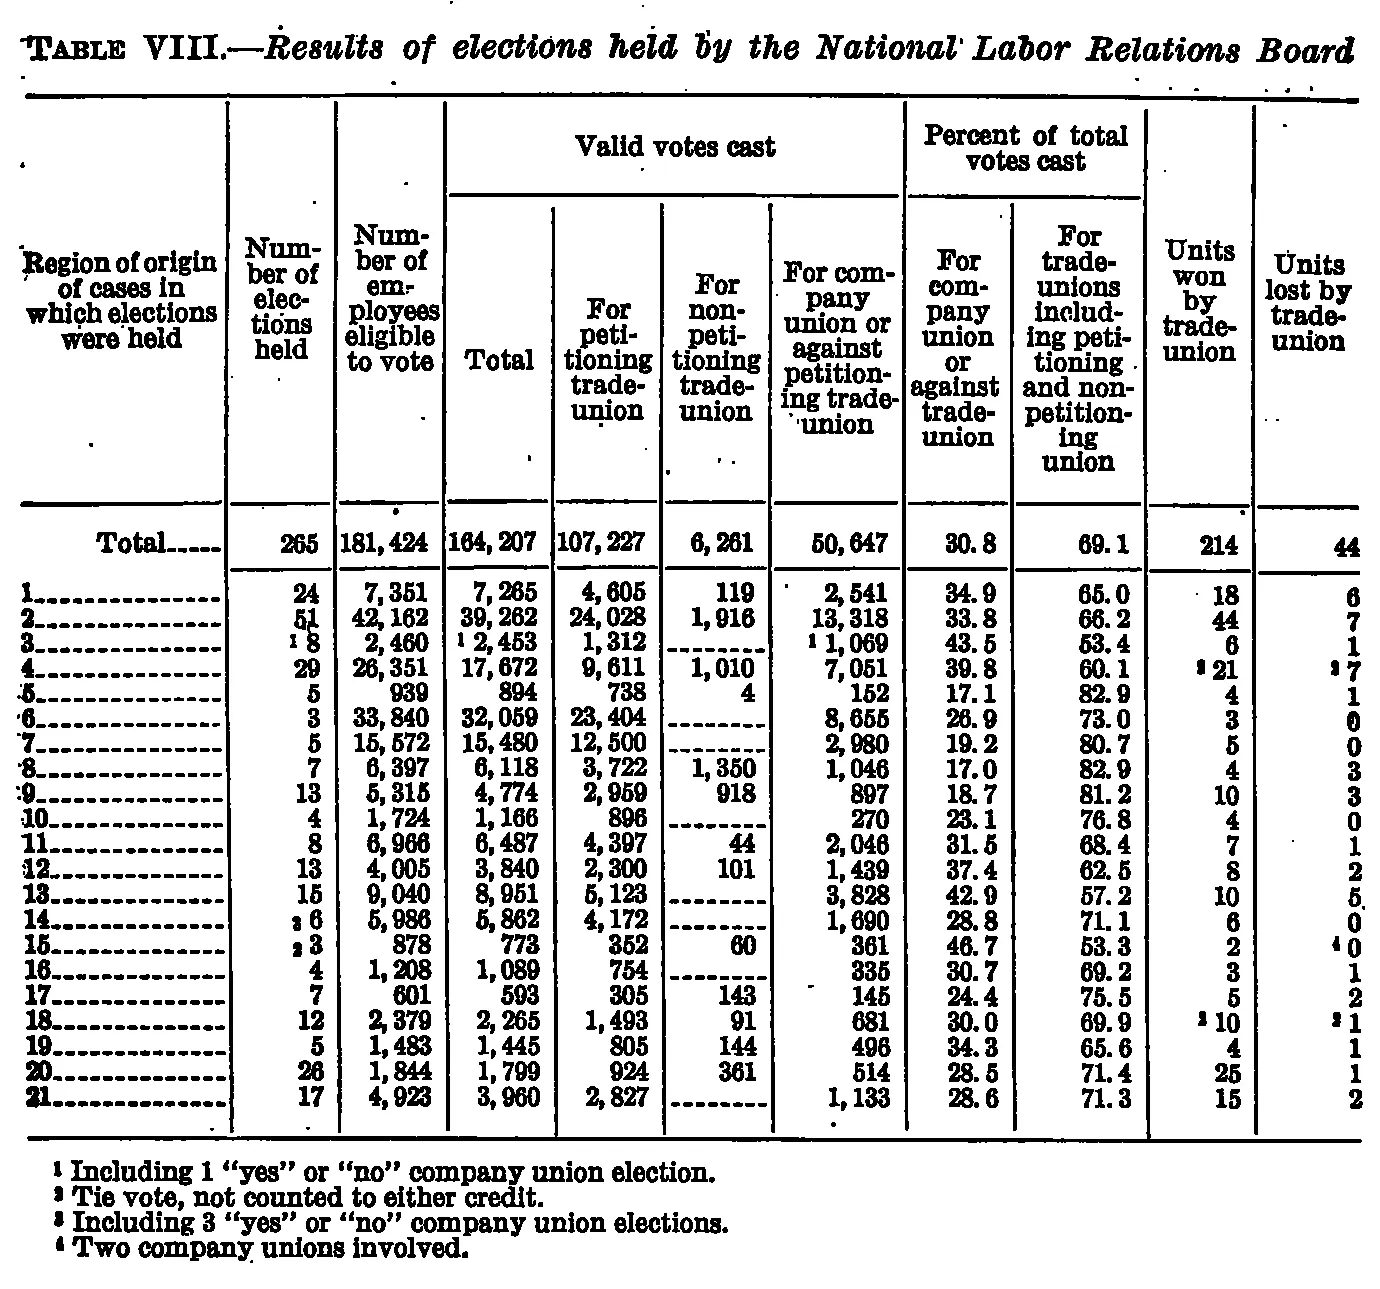
Results of elections held by the National Labor Relations Board
| Region of origin of cases in which elections were held | Number of elections held | Number of employees eligible to vote | Valid votes cast | Percent of total votes cast | Units won by trade-union | Units lost by trade-union | ||||
|---|---|---|---|---|---|---|---|---|---|---|
| Region of origin of cases in which elections were held | Number of elections held | Number of employees eligible to vote | Total | For petitioning trade-union | For non-petitioning trade-union | For company union or against petitioning trade-union | For company union or against trade-union | For trade-unions including petitioning and non-petitioning union | Units won by trade-union | Units lost by trade-union |
| Total | 265 | 181,424 | 164,207 | 107,227 | 6,261 | 50,647 | 30.8 | 69.1 | 214 | 44 |
| 1 | 24 | 7,351 | 7,265 | 4,605 | 119 | 2,541 | 34.9 | 65.0 | 18 | 6 |
| 2 | 51 | 42,162 | 39,262 | 24,028 | 1,916 | 13,318 | 33.8 | 66.2 | 44 | 7 |
| 3 | 8 | 2,460 | 2,453 | 1,312 | 1,069 | 43.5 | 53.4 | 6 | 1 | |
| 4 | 29 | 26,351 | 17,672 | 9,611 | 1,010 | 7,051 | 39.8 | 60.1 | 21 | 7 |
| 5 | 5 | 939 | 894 | 738 | 4 | 152 | 17.1 | 82.9 | 4 | 1 |
| 6 | 3 | 33,840 | 32,059 | 23,404 | 8,655 | 26.9 | 73.0 | 3 | 0 | |
| 7 | 5 | 15,572 | 15,480 | 12,500 | 2,980 | 19.2 | 80.7 | 5 | 0 | |
| 8 | 7 | 6,397 | 6,118 | 3,722 | 1,350 | 1,046 | 17.0 | 82.9 | 4 | 3 |
| 9 | 13 | 5,315 | 4,774 | 2,959 | 918 | 897 | 18.7 | 81.2 | 10 | 3 |
| 10 | 4 | 1,724 | 1,166 | 896 | 270 | 23.1 | 76.8 | 4 | 0 | |
| 11 | 8 | 6,966 | 6,487 | 4,397 | 44 | 2,046 | 31.5 | 68.4 | 7 | 1 |
| 12 | 13 | 4,005 | 3,840 | 2,300 | 101 | 1,439 | 37.4 | 62.5 | 8 | 2 |
| 13 | 15 | 9,040 | 8,951 | 5,123 | 3,828 | 42.9 | 57.2 | 10 | 5 | |
| 14 | 6 | 5,986 | 5,862 | 4,172 | 1,690 | 28.8 | 71.1 | 6 | 0 | |
| 15 | 3 | 878 | 773 | 352 | 60 | 361 | 46.7 | 53.3 | 2 | 0 |
| 16 | 4 | 1,208 | 1,089 | 754 | 335 | 30.7 | 69.2 | 3 | 1 | |
| 17 | 7 | 601 | 593 | 305 | 143 | 145 | 24.4 | 75.5 | 5 | 2 |
| 18 | 12 | 2,379 | 2,265 | 1,493 | 91 | 681 | 30.0 | 69.9 | 10 | 1 |
| 19 | 5 | 1,483 | 1,445 | 805 | 144 | 496 | 34.3 | 65.6 | 4 | 1 |
| 20 | 26 | 1,844 | 1,799 | 924 | 361 | 514 | 28.5 | 71.4 | 25 | 2 |
| 21 | 17 | 4,923 | 3,960 | 2,827 | 1,133 | 28.6 | 71.3 | 15 | 2 | |
- 1 Including 1 "yes" or "no" company union election.
- 2 Tie vote, not counted to either credit.
- 3 Including 3 "yes" or "no" company union elections.
- 4 Two company unions involved.
146 of 163 figures sit in a row or column sum that works out. 3 cells break a sum: 'Total', column 4: prints 164,207, columns 5 to 7 add to 164,135; '3', column 4: prints 2,453, columns 5 to 7 add to 2,381; 'Total', column 11: prints 44, rows '1' to '21' add to 45.
Reader’s notes
p. 36. Eleven columns; the stub holds only the region numbers 1-21 (leader dots dropped) plus the "Total" line. Arithmetic verification: every numeric column sums exactly to its printed total (265; 181,424; 164,207; 107,227; 6,261; 50,647; 214; 44), so the column placement of each value is confirmed. Footnote-marker digits are the main uncertainty. At 300 ppi the raised 2 and raised 3 are nearly indistinguishable in this typeface. I read the markers as raised digits at these cells: row 3 on "8" (Number of elections), "2,453" (Total valid votes) and "1,069" (For company union...); row 4 on "21" and "7" (Units won / Units lost); row 14 on "6" (Number of elections); row 15 on "3" (Number of elections) and on "0" (Units lost); row 18 on "10" and "1" (Units won / Units lost). The marker on row 3 is clearly a raised 1 and the one on row 15's Units lost is clearly a raised 4. For the ambiguous ones I assigned 2 to the Units-won/Units-lost pairs in rows 4 and 18 (footnote 2, "tie vote, not counted to either credit", which is what those columns would need) and 3 to the Number-of-elections cells in rows 14 and 15 (footnote 3, about yes/no company union elections). Rows 4, 15 and 18 are arithmetically consistent with that assignment (elections minus units won minus units lost leaves 1, 1 and 1 respectively); row 14 is not (6 elections = 6 won + 0 lost, leaving no uncredited elections), so the marker there may instead be a raised 2, or may belong on another row. Row 12 (13 elections vs 8 won + 2 lost) has a shortfall of 3 but shows no marker on the image. Suspected misprints, transcribed as printed: row 3's vote components (1,312 + 1,069 = 2,381) do not reach its printed valid-vote total of 2,453, a gap of 72 (row 3 carries footnote 1). Row 2's percentages, 33.8 and 66.2, do not follow from its vote columns (13,318/39,262 = 33.9; 25,944/39,262 = 66.0). Row 5's 17.1 does not follow either (152/894 = 17.0), nor does row 13's 42.9 (3,828/8,951 = 42.7, and 42.9 + 57.2 = 100.1). All other percentage pairs reproduce from the vote columns under truncation. Row 20 shows 26 elections against 25 units won plus 2 units lost, an excess of 1; the Units-lost column nonetheless sums to the printed 44 with the value 2 there. Dash rules in the "For non-petitioning trade-union" column (rows 6, 7, 10, 13, 14, 16, 21) are rendered as empty cells; row 3's blank in that column is likewise empty. The caption, footnote rules and page furniture are omitted.
Source image
Source data: U.S. NLRB Annual Reports (public domain). Reconstruction by NLRB Stats Archive. Read by claude-opus-5 (effort max, prompt extract_v1) from the 300-dpi scan; stitched by page. Updated October 2026.