NLRB Stats Archive › Annual Reports › FY1937 › Analysis of charges
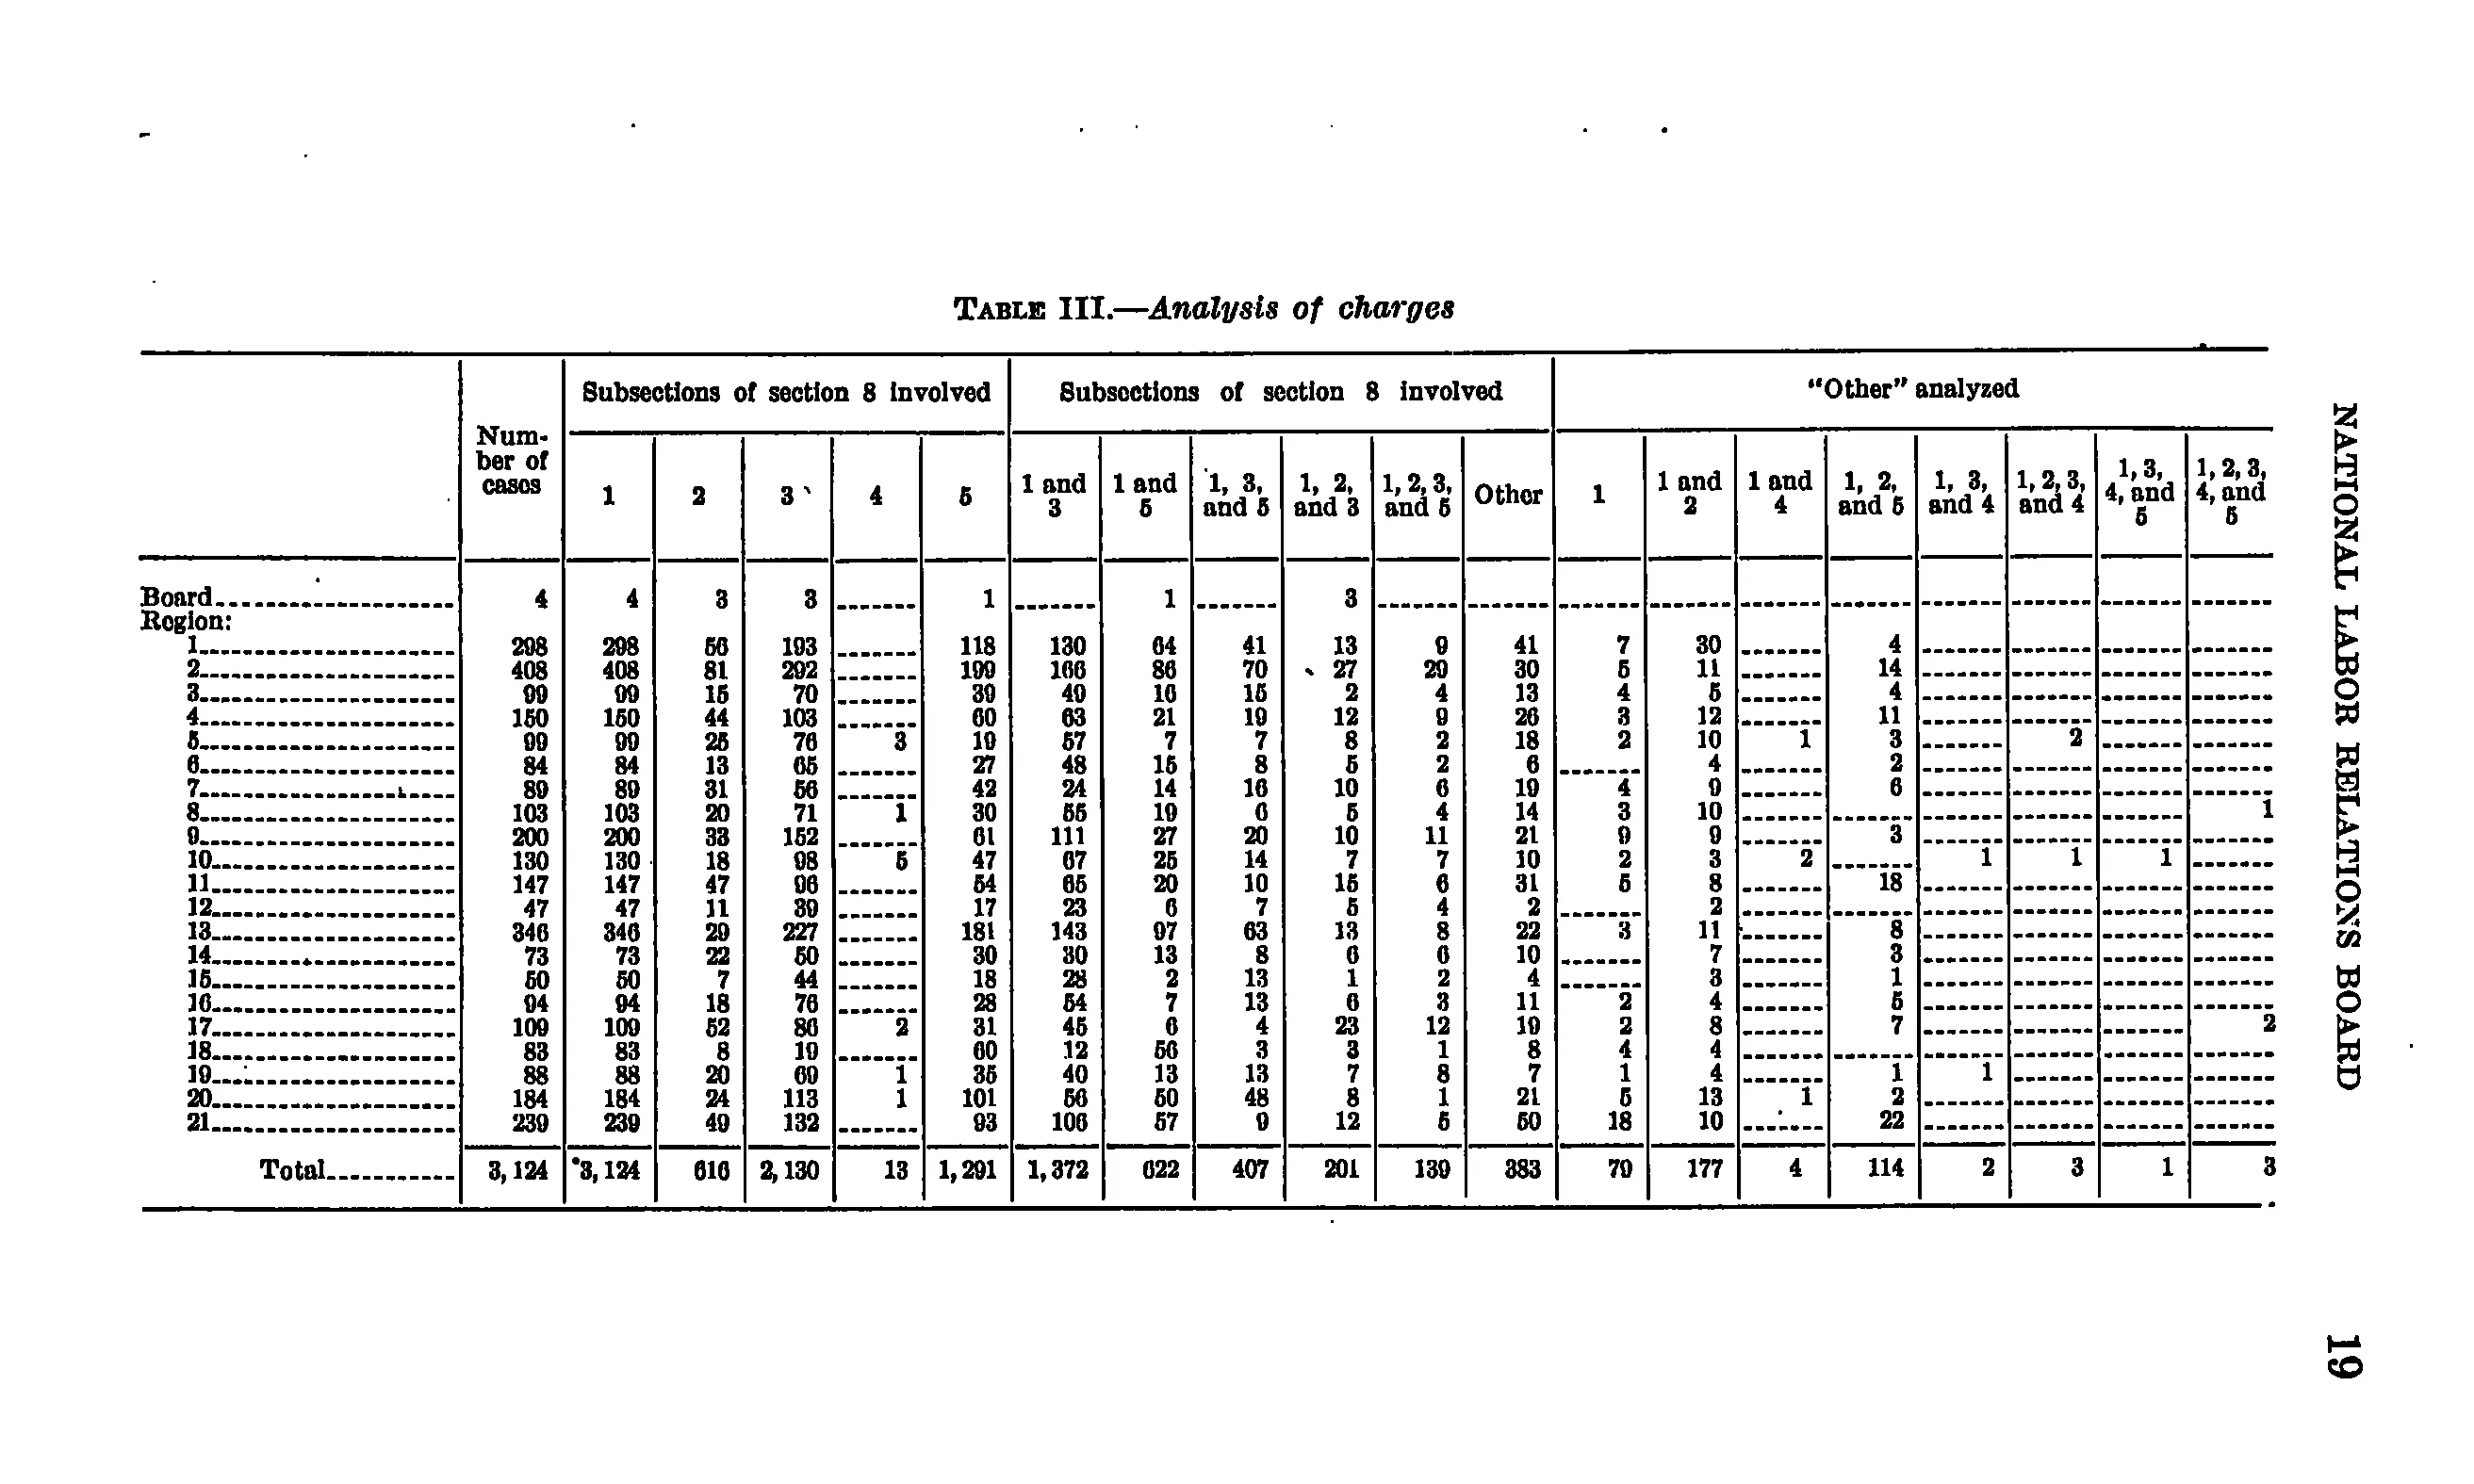
Analysis of charges
| Number of cases | Subsections of section 8 involved | "Other" analyzed | ||||||||||||||||||
|---|---|---|---|---|---|---|---|---|---|---|---|---|---|---|---|---|---|---|---|---|
| Number of cases | 1 | 2 | 3 | 4 | 5 | 1 and 3 | 1 and 5 | 1, 3, and 5 | 1, 2, and 3 | 1, 2, 3, and 5 | Other | 1 | 1 and 2 | 1 and 4 | 1, 2, and 5 | 1, 3, and 4 | 1, 2, 3, and 4 | 1, 3, 4, and 5 | 1, 2, 3, 4, and 5 | |
| Board | 4 | 4 | 3 | 3 | 1 | 1 | 3 | |||||||||||||
| Region: | ||||||||||||||||||||
| 1 | 298 | 298 | 56 | 193 | 118 | 130 | 64 | 41 | 13 | 9 | 41 | 7 | 30 | 4 | ||||||
| 2 | 408 | 408 | 81 | 292 | 199 | 166 | 86 | 70 | 27 | 29 | 30 | 5 | 11 | 14 | ||||||
| 3 | 99 | 99 | 15 | 70 | 39 | 49 | 16 | 15 | 2 | 4 | 13 | 4 | 5 | 4 | ||||||
| 4 | 150 | 150 | 44 | 103 | 60 | 63 | 21 | 19 | 12 | 9 | 26 | 3 | 12 | 11 | ||||||
| 5 | 99 | 99 | 25 | 76 | 3 | 19 | 57 | 7 | 7 | 8 | 2 | 18 | 2 | 10 | 1 | 3 | 2 | |||
| 6 | 84 | 84 | 13 | 65 | 27 | 48 | 15 | 8 | 5 | 2 | 6 | 4 | 2 | |||||||
| 7 | 89 | 89 | 31 | 56 | 42 | 24 | 14 | 16 | 10 | 6 | 19 | 4 | 9 | 6 | ||||||
| 8 | 103 | 103 | 20 | 71 | 1 | 30 | 55 | 19 | 6 | 5 | 4 | 14 | 3 | 10 | 1 | |||||
| 9 | 200 | 200 | 33 | 152 | 61 | 111 | 27 | 20 | 10 | 11 | 21 | 9 | 9 | 3 | ||||||
| 10 | 130 | 130 | 18 | 98 | 5 | 47 | 67 | 25 | 14 | 7 | 7 | 10 | 2 | 3 | 2 | 1 | 1 | 1 | ||
| 11 | 147 | 147 | 47 | 96 | 54 | 65 | 20 | 10 | 15 | 6 | 31 | 5 | 8 | 18 | ||||||
| 12 | 47 | 47 | 11 | 39 | 17 | 23 | 6 | 7 | 5 | 4 | 2 | 2 | ||||||||
| 13 | 346 | 346 | 29 | 227 | 181 | 143 | 97 | 63 | 13 | 8 | 22 | 3 | 11 | 8 | ||||||
| 14 | 73 | 73 | 22 | 50 | 30 | 30 | 13 | 8 | 6 | 6 | 10 | 7 | 3 | |||||||
| 15 | 50 | 50 | 7 | 44 | 18 | 28 | 2 | 13 | 1 | 2 | 4 | 3 | 1 | |||||||
| 16 | 94 | 94 | 18 | 76 | 28 | 54 | 7 | 13 | 6 | 3 | 11 | 2 | 4 | 5 | ||||||
| 17 | 109 | 109 | 52 | 86 | 2 | 31 | 45 | 6 | 4 | 23 | 12 | 19 | 2 | 8 | 7 | 2 | ||||
| 18 | 83 | 83 | 8 | 19 | 60 | 12 | 56 | 3 | 3 | 1 | 8 | 4 | 4 | |||||||
| 19 | 88 | 88 | 20 | 69 | 1 | 35 | 40 | 13 | 13 | 7 | 8 | 7 | 1 | 4 | 1 | 1 | ||||
| 20 | 184 | 184 | 24 | 113 | 1 | 101 | 56 | 50 | 48 | 8 | 1 | 21 | 5 | 13 | 1 | 2 | ||||
| 21 | 239 | 239 | 49 | 132 | 93 | 106 | 57 | 9 | 12 | 5 | 50 | 18 | 10 | 22 | ||||||
| Total | 3,124 | 3,124 | 616 | 2,130 | 13 | 1,291 | 1,372 | 622 | 407 | 201 | 139 | 383 | 79 | 177 | 4 | 114 | 2 | 3 | 1 | 3 |
306 of 329 figures sit in a row or column sum that works out. 4 cells break a sum: '8', column 13: prints 14, columns 14 to 20 add to 13; '17', column 13: prints 19, columns 14 to 20 add to 17; 'Total', column 13: prints 383, columns 14 to 20 add to 380; 'Total', column 4: prints 616, rows 'Board' to '21' add to 626.
Reader’s notes
p. 25. 21 columns: stub, "Number of cases" (a tall heading spanning both levels), five single-subsection columns under the first "Subsections of section 8 involved" banner, six combination columns under the second banner of the same wording, and eight columns under "Other" analyzed. The stub itself carries no printed heading. The stub reads "Board", then the section line "Region:" with no values, then regions 1-21 (printed as bare numerals followed by leader dots), then "Total". Empty cells are printed as dash rules or left blank. Verification: I checked every column against its printed total and every row against its own breakdown (each combination column feeds the single-subsection columns, and the eight "Other" analyzed columns must sum to the "Other" column). 18 of the 20 printed column totals reconcile exactly, which makes the grid placement reliable. Degraded glyphs (this scan renders some 9s with a broken descender that reads as 0). In five cells I transcribed a 9 that my view of the image renders as 0, because two independent sums each require the 9; a reader checking the page should confirm these: region 3 "1 and 3" = 49 (needed by both the row total 99 and the printed column total 1,372); region 5 column "1" = 99 (every row repeats its case count here, and the column total is 3,124); region 8 "1 and 5" = 19 (column total 622 and the row's subsection-5 count 30); region 19 column "3" = 69 (column total 2,130); Total row, "Other" analyzed column "1" = 79 (the 21 region entries sum to 79, and 383 minus the other seven "Other"-analyzed totals is 79). The last of these is the least certain: it renders as "70" and would be a one-off compiler error if it is. Apparent misprints, transcribed as printed: region 6, column "3" = 65, but that row's combinations (48+8+5+2) give 63; the printed column total 2,130 requires the 65. Region 13, column "2" = 29, but its breakdown (13+8+11+8) gives 40; the printed column total 616 matches neither the sum of the printed cells in that column (626) nor the breakdown-implied sum (637), so two figures in column "2" disagree. Region 13, column "5" = 181, while its breakdown (97+63+8+8) gives 176; the printed column total 1,291 requires the 181. A small raised dot sits immediately before "3,124" in the Total row under column "1". No footnotes are printed under the table, so I treated it as a speck rather than a marker and left it out of the cell. Similar isolated specks appear after the "3" column heading, before the "1, 3, and 5" heading, and left of the "27" in region 2's "1, 2, and 3" cell; none are footnote markers.
Source image
Source data: U.S. NLRB Annual Reports (public domain). Reconstruction by NLRB Stats Archive. Read by claude-opus-5 (effort max, prompt extract_v1) from the 300-dpi scan; stitched by page. Updated October 2026.