NLRB Stats Archive › Annual Reports › FY1936 › Results of elections held by the National Labor Relations Board
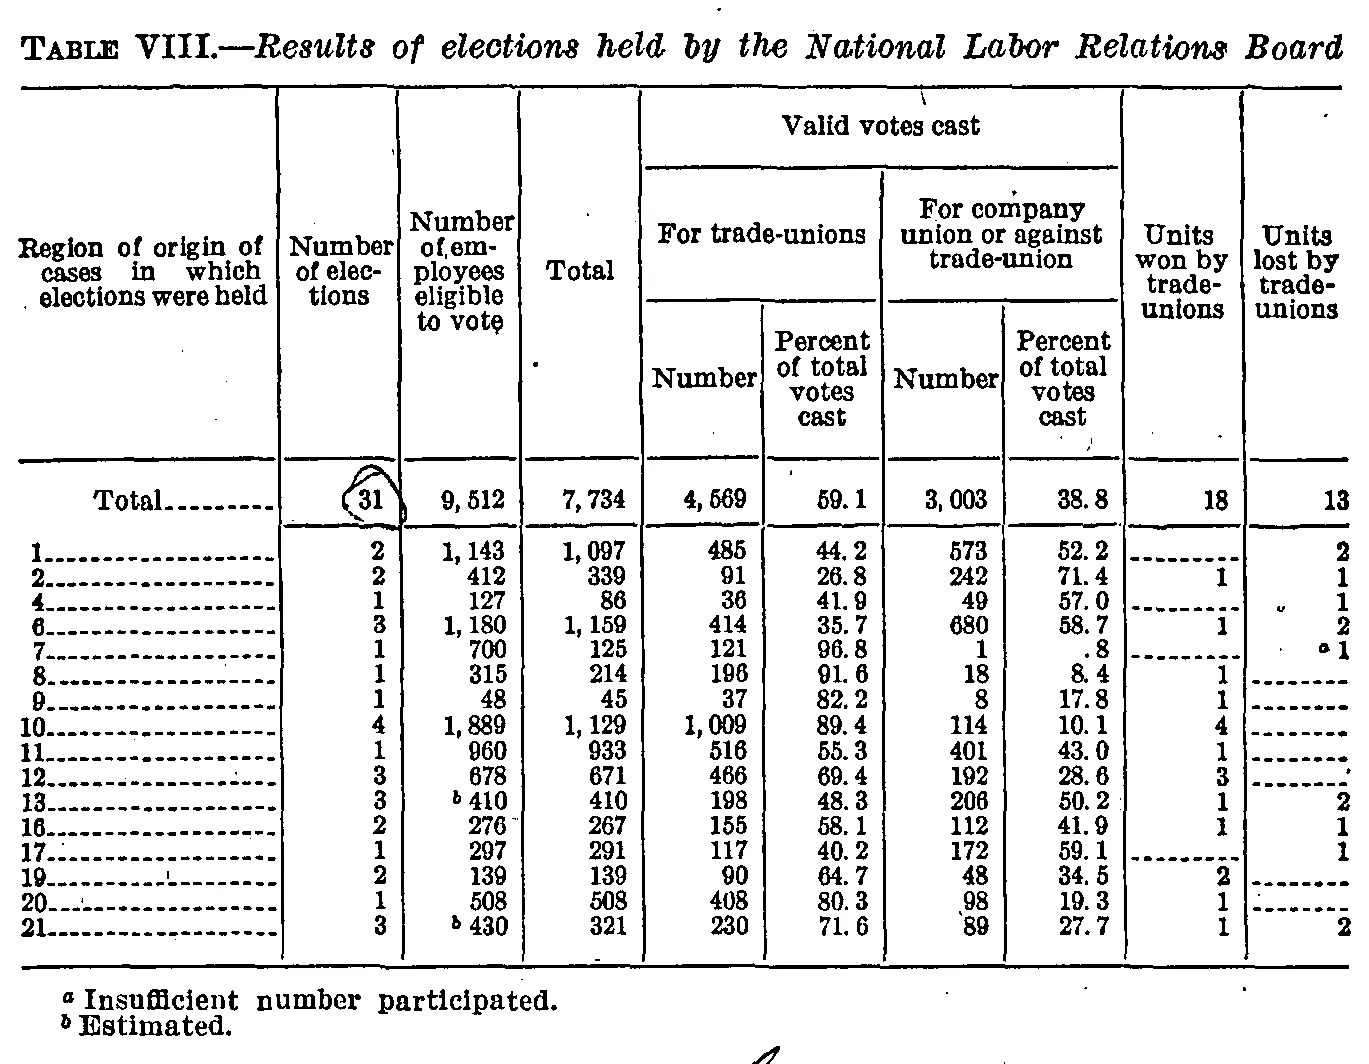
Results of elections held by the National Labor Relations Board
| Region of origin of cases in which elections were held | Number of elections | Number of employees eligible to vote | Valid votes cast | Units won by trade-unions | Units lost by trade-unions | ||||
|---|---|---|---|---|---|---|---|---|---|
| Region of origin of cases in which elections were held | Number of elections | Number of employees eligible to vote | Total | For trade-unions | For company union or against trade-union | Units won by trade-unions | Units lost by trade-unions | ||
| Region of origin of cases in which elections were held | Number of elections | Number of employees eligible to vote | Total | Number | Percent of total votes cast | Number | Percent of total votes cast | Units won by trade-unions | Units lost by trade-unions |
| Total | 31 | 9,512 | 7,734 | 4,569 | 59.1 | 3,003 | 38.8 | 18 | 13 |
| 1 | 2 | 1,143 | 1,097 | 485 | 44.2 | 573 | 52.2 | 2 | |
| 2 | 2 | 412 | 339 | 91 | 26.8 | 242 | 71.4 | 1 | 1 |
| 4 | 1 | 127 | 86 | 36 | 41.9 | 49 | 57.0 | 1 | |
| 6 | 3 | 1,180 | 1,159 | 414 | 35.7 | 680 | 58.7 | 1 | 2 |
| 7 | 1 | 700 | 125 | 121 | 96.8 | 1 | .8 | 1 | |
| 8 | 1 | 315 | 214 | 196 | 91.6 | 18 | 8.4 | 1 | |
| 9 | 1 | 48 | 45 | 37 | 82.2 | 8 | 17.8 | 1 | |
| 10 | 4 | 1,889 | 1,129 | 1,009 | 89.4 | 114 | 10.1 | 4 | |
| 11 | 1 | 960 | 933 | 516 | 55.3 | 401 | 43.0 | 1 | |
| 12 | 3 | 678 | 671 | 466 | 69.4 | 192 | 28.6 | 3 | |
| 13 | 3 | 410 | 410 | 198 | 48.3 | 206 | 50.2 | 1 | 2 |
| 16 | 2 | 276 | 267 | 155 | 58.1 | 112 | 41.9 | 1 | 1 |
| 17 | 1 | 297 | 291 | 117 | 40.2 | 172 | 59.1 | 1 | |
| 19 | 2 | 139 | 139 | 90 | 64.7 | 48 | 34.5 | 2 | |
| 20 | 1 | 508 | 508 | 408 | 80.3 | 98 | 19.3 | 1 | |
| 21 | 3 | 430 | 321 | 230 | 71.6 | 89 | 27.7 | 1 | 2 |
- a Insufficient number participated.
- b Estimated.
108 of 108 figures sit in a row or column sum that works out.
Reader’s notes
p. 51. Ten columns: stub, Number of elections, Number of employees eligible to vote, then five columns under the spanning head "Valid votes cast" (Total; Number and Percent under "For trade-unions"; Number and Percent under "For company union or against trade-union"), then Units won by trade-unions and Units lost by trade-unions. Doubtful cell: row "11", column "For trade-unions / Number". The scanned glyph could be read as 518 or 516; I transcribed 516 because both internal checks require it — 516/933 = 55.3 percent as printed, and the column sums to the printed total 4,569 only with 516 (518 would give 4,571). Every other cell in that column is unambiguous. Arithmetic checks on the rest of the table are all consistent with the printed Total row: Number of elections sums to 31, employees eligible to 9,512, valid votes Total to 7,734, company-union Number to 3,003, Units won to 18, Units lost to 13. Row 7 carries footnote marker "a" printed to the left of the value 1 in the last column (Units lost by trade-unions); rows 13 and 21 carry marker "b" printed to the left of the values in "Number of employees eligible to vote". These are recorded with carets after the values. The value 31 in the Total row, "Number of elections", is circled in ink by a later hand; the printed digits are clear and unaltered. Scattered faint ink dots and a stray pen mark appear in the margins and below the table (including an unrelated handwritten mark under the footnotes); none obscure a value. The stub lists only the regions that held elections, so the region numbers are not consecutive (3, 5, 14, 15, 18 are absent); this is as printed, not a transcription gap. Cells shown as a dash rule in the Units won/Units lost columns are transcribed as empty. The caption is excluded as instructed; it runs to the right edge of the crop and may be slightly clipped there, but no table column is cut off.
Source image
Source data: U.S. NLRB Annual Reports (public domain). Reconstruction by NLRB Stats Archive. Read by claude-opus-5 (effort max, prompt extract_v1) from the 300-dpi scan; stitched by page. Updated October 2026.