NLRB Stats Archive › Annual Reports › FY1936 › Analysis of charges filed
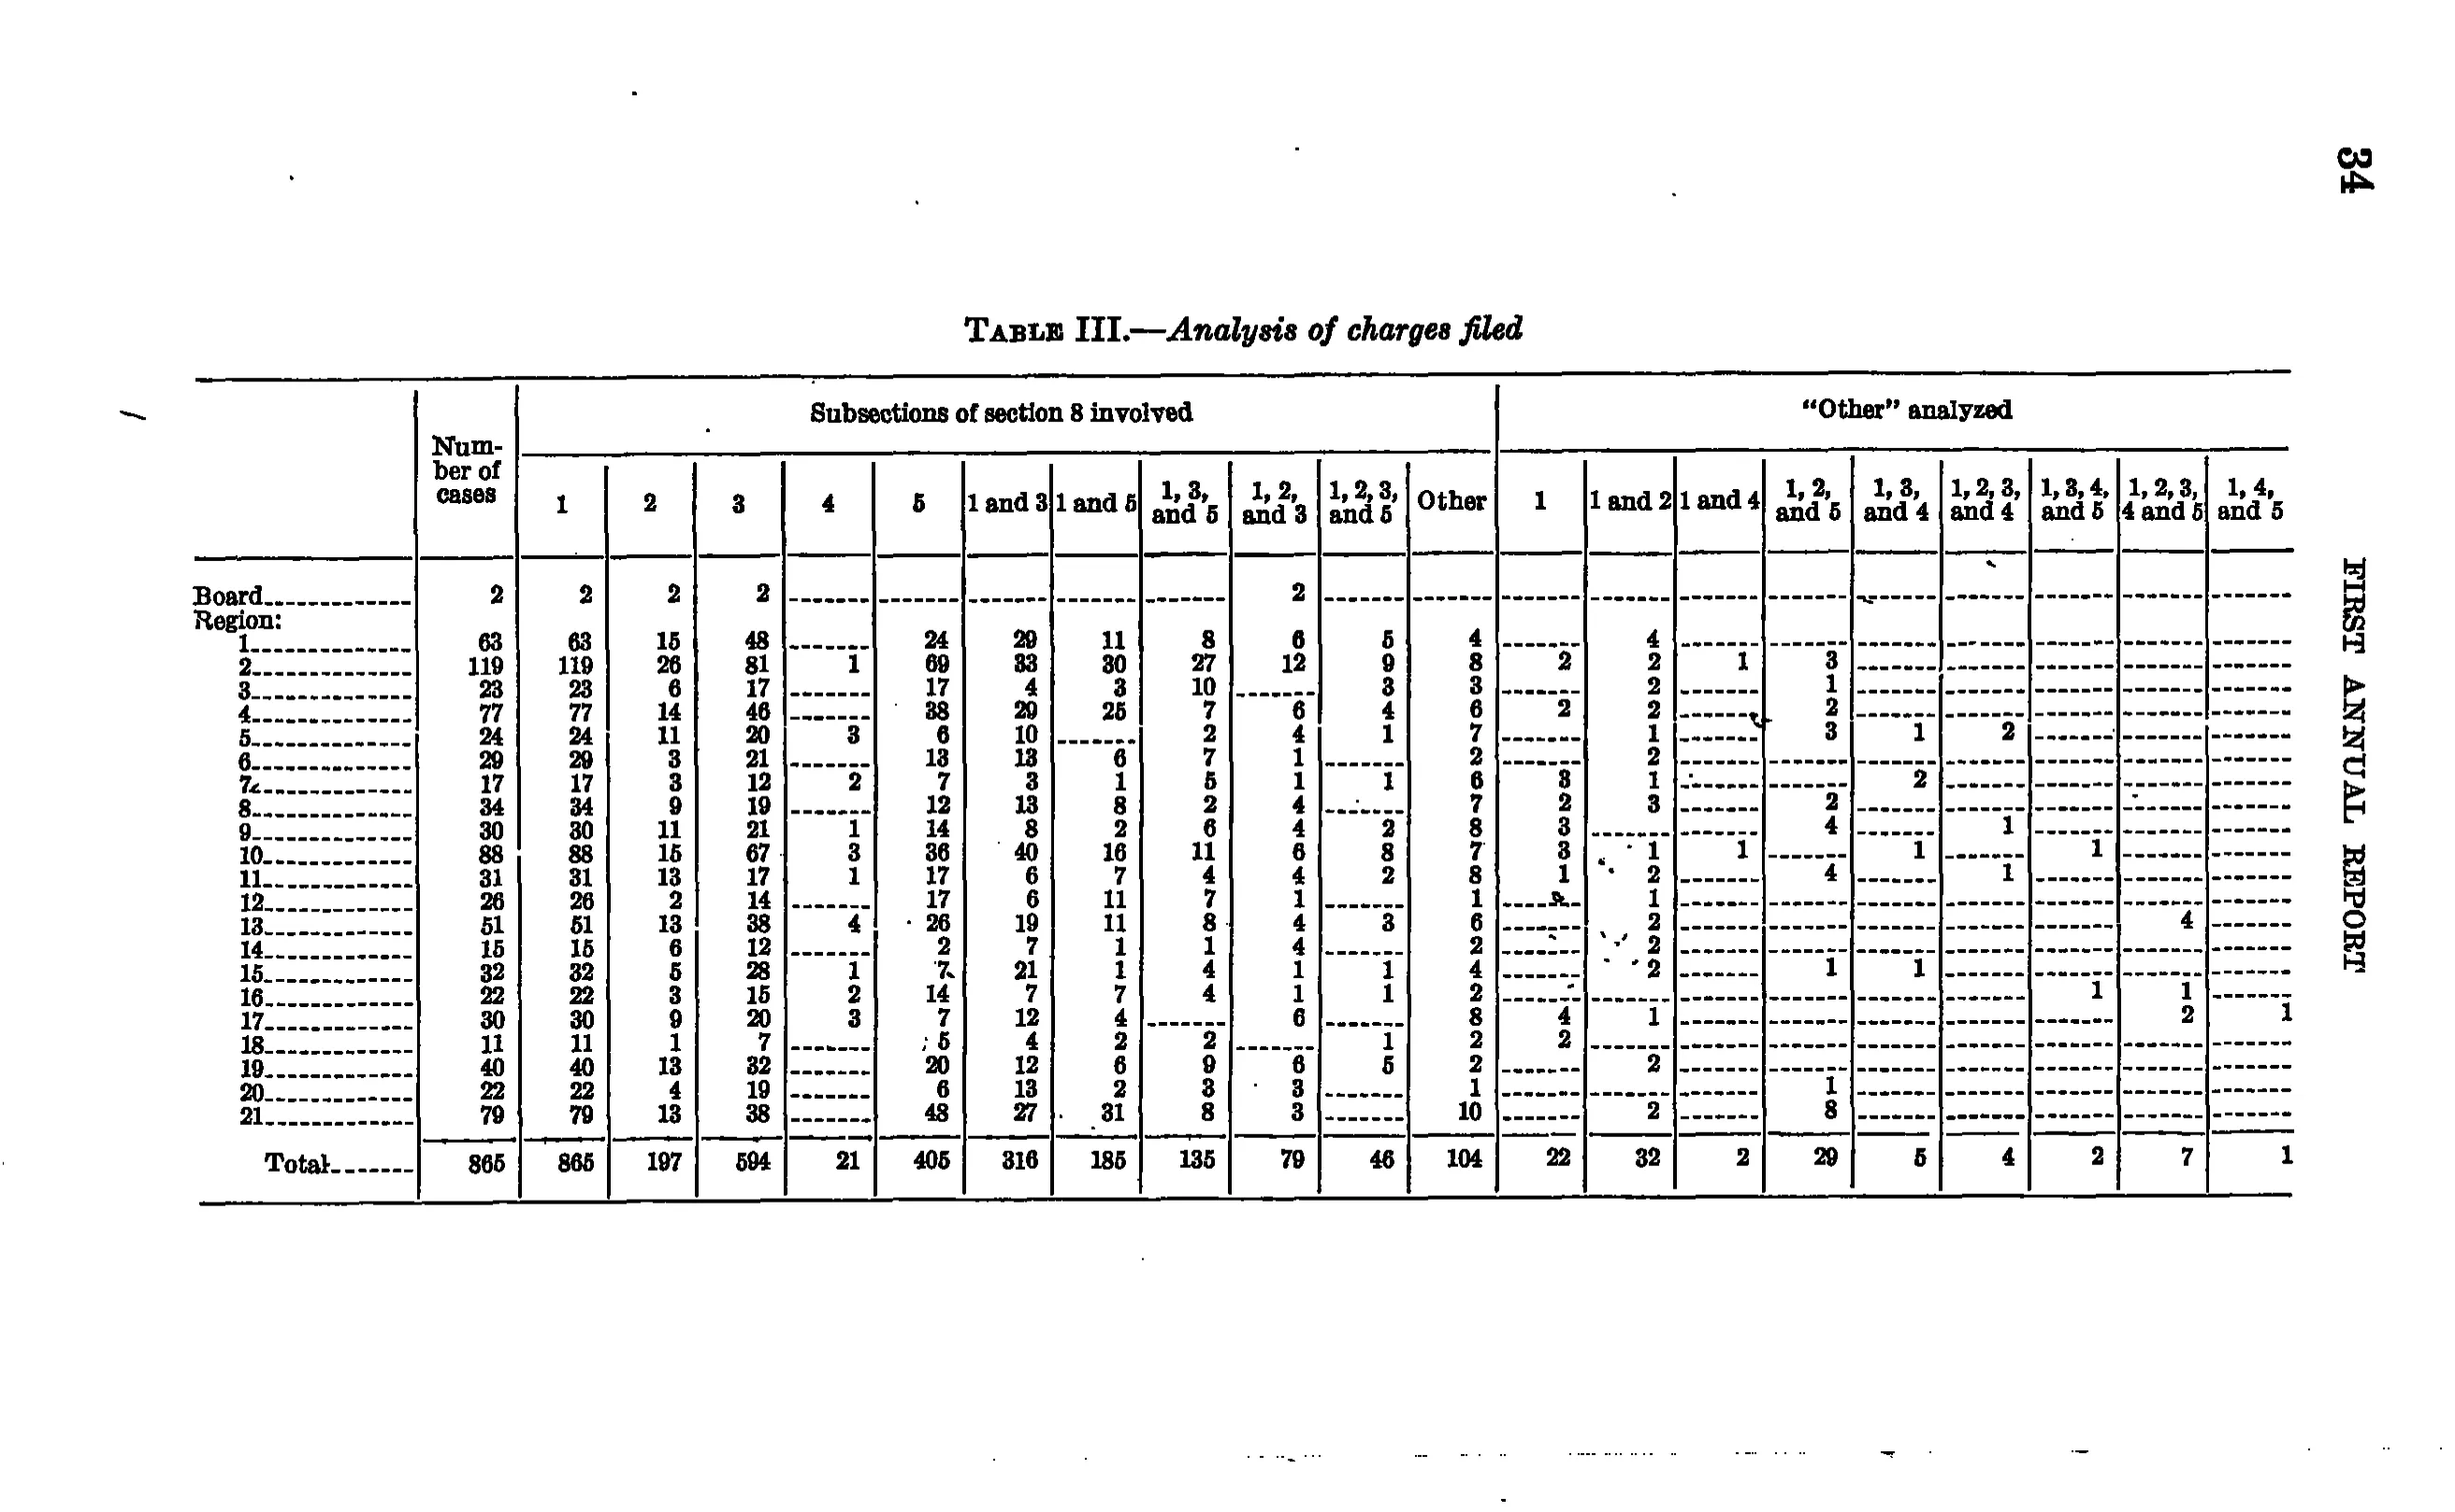
Analysis of charges filed
| Number of cases | Subsections of section 8 involved | "Other" analyzed | |||||||||||||||||||
|---|---|---|---|---|---|---|---|---|---|---|---|---|---|---|---|---|---|---|---|---|---|
| Number of cases | 1 | 2 | 3 | 4 | 5 | 1 and 3 | 1 and 5 | 1, 3, and 5 | 1, 2, and 3 | 1, 2, 3, and 5 | Other | 1 | 1 and 2 | 1 and 4 | 1, 2, and 5 | 1, 3, and 4 | 1, 2, 3, and 4 | 1, 3, 4, and 5 | 1, 2, 3, 4 and 5 | 1, 4, and 5 | |
| Board | 2 | 2 | 2 | 2 | 2 | ||||||||||||||||
| Region: | |||||||||||||||||||||
| 1 | 63 | 63 | 15 | 48 | 24 | 29 | 11 | 8 | 6 | 5 | 4 | 4 | |||||||||
| 2 | 119 | 119 | 26 | 81 | 1 | 69 | 33 | 30 | 27 | 12 | 9 | 8 | 2 | 2 | 1 | 3 | |||||
| 3 | 23 | 23 | 6 | 17 | 17 | 4 | 3 | 10 | 3 | 3 | 2 | 1 | |||||||||
| 4 | 77 | 77 | 14 | 46 | 38 | 29 | 25 | 7 | 6 | 4 | 6 | 2 | 2 | 2 | |||||||
| 5 | 24 | 24 | 11 | 20 | 3 | 6 | 10 | 2 | 4 | 1 | 7 | 1 | 3 | 1 | 2 | ||||||
| 6 | 29 | 29 | 3 | 21 | 13 | 13 | 6 | 7 | 1 | 2 | 2 | ||||||||||
| 7 | 17 | 17 | 3 | 12 | 2 | 7 | 3 | 1 | 5 | 1 | 1 | 6 | 3 | 1 | 2 | ||||||
| 8 | 34 | 34 | 9 | 19 | 12 | 13 | 8 | 2 | 4 | 7 | 2 | 3 | 2 | ||||||||
| 9 | 30 | 30 | 11 | 21 | 1 | 14 | 8 | 2 | 6 | 4 | 2 | 8 | 3 | 4 | 1 | ||||||
| 10 | 88 | 88 | 15 | 67 | 3 | 36 | 40 | 16 | 11 | 6 | 8 | 7 | 3 | 1 | 1 | 1 | 1 | ||||
| 11 | 31 | 31 | 13 | 17 | 1 | 17 | 6 | 7 | 4 | 4 | 2 | 8 | 1 | 2 | 4 | 1 | |||||
| 12 | 26 | 26 | 2 | 14 | 17 | 6 | 11 | 7 | 1 | 1 | 2 | ||||||||||
| 13 | 51 | 51 | 13 | 38 | 4 | 26 | 19 | 11 | 8 | 4 | 3 | 6 | 2 | 4 | |||||||
| 14 | 15 | 15 | 6 | 12 | 2 | 7 | 1 | 1 | 4 | 2 | 2 | ||||||||||
| 15 | 32 | 32 | 5 | 28 | 1 | 7 | 21 | 1 | 4 | 1 | 1 | 4 | 2 | 1 | 1 | ||||||
| 16 | 22 | 22 | 3 | 15 | 2 | 14 | 7 | 7 | 4 | 1 | 1 | 2 | 1 | 1 | |||||||
| 17 | 30 | 30 | 9 | 20 | 3 | 7 | 12 | 4 | 6 | 8 | 4 | 1 | 2 | 1 | |||||||
| 18 | 11 | 11 | 1 | 7 | 5 | 4 | 2 | 2 | 1 | 2 | 2 | ||||||||||
| 19 | 40 | 40 | 13 | 32 | 20 | 12 | 6 | 9 | 6 | 5 | 2 | 2 | |||||||||
| 20 | 22 | 22 | 4 | 19 | 6 | 13 | 2 | 3 | 3 | 1 | 1 | ||||||||||
| 21 | 79 | 79 | 13 | 38 | 43 | 27 | 31 | 8 | 3 | 10 | 2 | 8 | |||||||||
| Total | 865 | 865 | 197 | 594 | 21 | 405 | 316 | 185 | 135 | 79 | 46 | 104 | 22 | 32 | 2 | 29 | 5 | 4 | 2 | 7 | 1 |
267 of 307 figures sit in a row or column sum that works out. 2 cells break a sum: 'Total', column 7: prints 405, rows 'Board' to '21' add to 400; 'Total', column 15: prints 32, rows 'Board' to '21' add to 33.
Reader’s notes
p. 40. 22 columns: stub, "Number of cases", 11 columns under "Subsections of section 8 involved", and 9 columns under "\"Other\" analyzed". The stub has no printed heading, so the stub cell is empty in both heading levels; "Number of cases" is a tall heading spanning both levels and is repeated. Row labels: the region rows are printed "1." through "21." followed by leader dots; "Region:" is a section line with no values. Empty body cells are printed as dash rules. Verification: every column was summed against its printed total. "Number of cases" (865), "1" (865), "2" (197), "3" (594), "4" (21), "1 and 3" (316), "1 and 5" (185), "1, 3, and 5" (135), "1, 2, and 3" (79), "1, 2, 3, and 5" (46), "Other" (104) and all nine "Other analyzed" columns except "1 and 2" reconcile exactly as transcribed. Two discrepancies remain, both in cells I could not resolve at this scan resolution: 1. Column "5": the rows as transcribed sum to 400, against the printed total 405. The shortfall sits in exactly two rows. Row 12, column "5" is transcribed 17, but that row's mutually exclusive combination columns give 11 ("1 and 5") + 7 ("1, 3, and 5") = 18. Row 21, column "5" is transcribed 43, but its combinations give 31 ("1 and 5") + 8 ("1, 3, and 5") + 8 ("1, 2, and 5") = 47. Using 18 and 47 would make the column sum to the printed 405 exactly. I transcribed the glyphs as I read them (17 and 43); these may be misprints, or 7/8 and 3/7 confusions on my part at this resolution. 2. Row 12, column "1 and 2" (under "Other analyzed") is transcribed 2, but that row's "Other" count is 1 and its column "2" value is 2 (= 1 from "1, 2, and 3" + 1), both of which imply 1; my column sum is 33 against the printed total 32. The paper is speckled/smudged in the "Other analyzed" panel around rows 12-15, so this cell is doubtful and may read 1. The "1" in the "1 and 4" column in the rows 1-2 area is placed on row 2 (row 2's "Other" = 8 = 2 + 2 + 1 + 3; row 1's "Other" = 4 is fully accounted for by the 4 under "1 and 2"), and the column total of 2 is then satisfied by rows 2 and 10.
Source image
Source data: U.S. NLRB Annual Reports (public domain). Reconstruction by NLRB Stats Archive. Read by claude-opus-5 (effort max, prompt extract_v1) from the 300-dpi scan; stitched by page. Updated October 2026.