Home › FY1962 › Collective bargaining elections
Collective bargaining elections
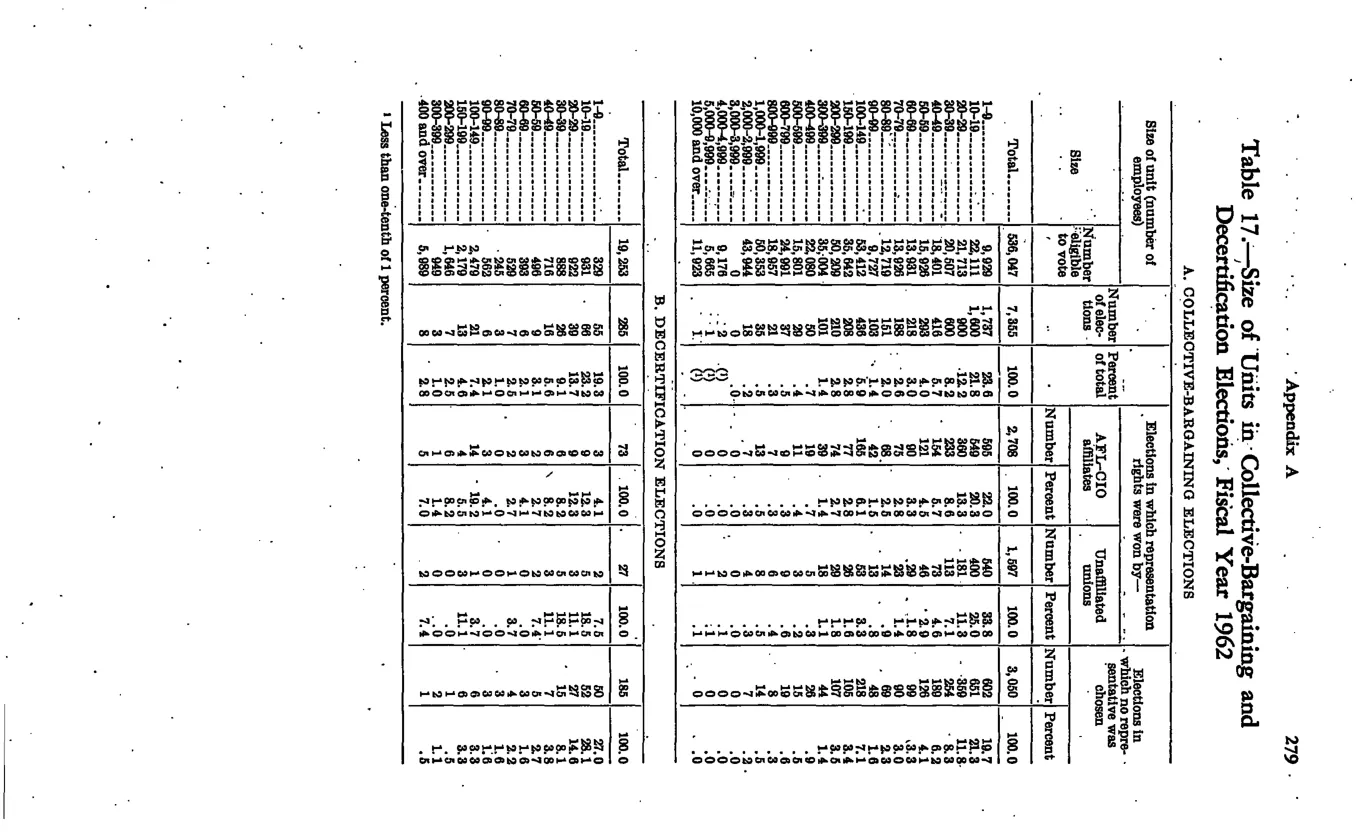
| Size of unit (number of employees) | Number eligible to vote | Number of elections | Percent of total | Elections in which representation rights were won by AFL-CIO affiliates — Number | Elections in which representation rights were won by AFL-CIO affiliates — Percent | Elections in which representation rights were won by Unaffiliated unions — Number | Elections in which representation rights were won by Unaffiliated unions — Percent | Elections in which no representative was chosen — Number | Elections in which no representative was chosen — Percent |
|---|---|---|---|---|---|---|---|---|---|
| Total | 536,047 | 7,355 | 100 | 2,708 | 100 | 1,597 | 100 | 3,050 | 100 |
| [Size-strata sub-rows below — 1-9, 10-19, 20-29, 30-39, 40-49, 50-59, 60-69, 70-79, 80-89, 90-99, 100-149, 150-199, 200-299, 300-399, 400-499, 500-999, 1,000-1,999, 2,000-2,999, 3,000-3,999, 4,000-4,999, 5,000-9,999, 10,000-and-over employees — captured at top-level only due to rotated landscape page density] |
Source image
Source data: U.S. NLRB Annual Reports (public domain). Reconstruction by NLRB Stats Archive. Verify figures against the source scan. Updated June 2026. · About