Home › FY1962 › Industrial distribution of cases received
Industrial distribution of cases received
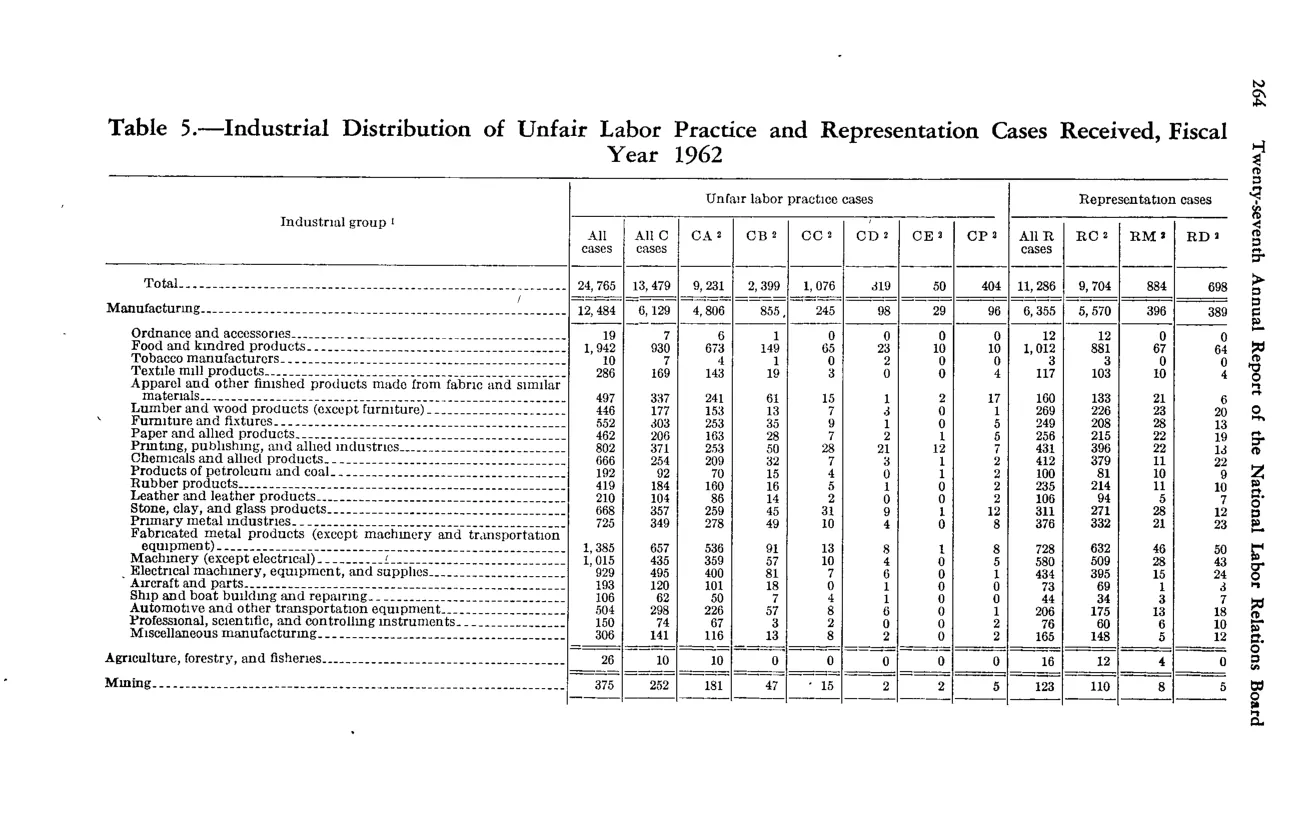
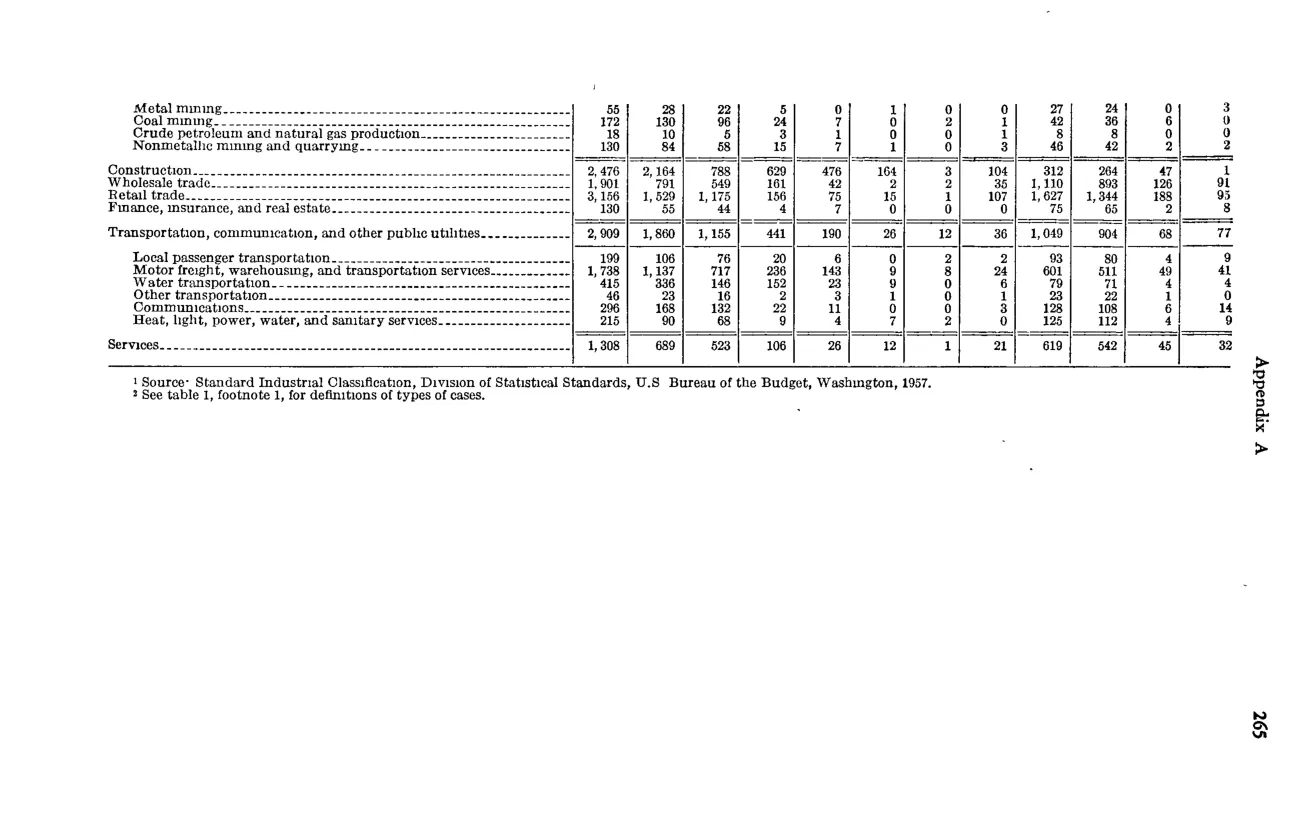
Stitched from 2 consecutive pages (spans pp. 278–279). Combined rows under the first part’s headers; source images for every part are shown below. component ids
| Total | 24,765 | 13,479 | 9,231 | 2,399 | 1,076 | 319 | 50 | 404 | 11,286 | 9,704 | 884 | 698 |
|---|---|---|---|---|---|---|---|---|---|---|---|---|
| Manufacturing | 12,484 | 6,129 | 4,806 | · | 245 | 98 | 2 | 96 | 6,355 | 5,570 | 396 | 389 |
| Ordnance and accessories | 19 | 7 | 6 | 1 | 0 | 0 | 0 | 12 | 12 | 0 | 0 | |
| Food and kindred products | 1,942 | 930 | 673 | 149 | 65 | 23 | 1 | 10 | 1,012 | 881 | 67 | 64 |
| Tobacco manufacturers | 10 | 7 | 4 | 1 | 0 | 2 | 0 | 3 | 3 | 0 | 0 | |
| Textile mill products | 286 | 169 | 143 | 19 | 3 | 0 | 4 | 117 | 103 | 10 | 4 | |
| Apparel and other finished products made from fabric and similar materials | 497 | 337 | 241 | 61 | 15 | 1 | 17 | 160 | 133 | 21 | 6 | |
| Lumber and wood products (except furniture) | 446 | 177 | 153 | 13 | 7 | 3 | 1 | 269 | 226 | 23 | 20 | |
| Furniture and fixtures | 552 | 303 | 253 | 35 | 9 | 1 | 5 | 249 | 208 | 28 | 13 | |
| Paper and allied products | 462 | 206 | 163 | 28 | 7 | 2 | 5 | 256 | 215 | 22 | 19 | |
| Printing, publishing, and allied industries | 802 | 371 | 253 | 50 | 28 | 21 | 1 | 7 | 431 | 396 | 22 | 13 |
| Chemicals and allied products | 666 | 254 | 209 | 32 | 7 | 3 | 2 | 412 | 379 | 11 | 22 | |
| Products of petroleum and coal | 192 | 92 | 70 | 15 | 4 | 0 | 2 | 100 | 81 | 10 | 9 | |
| Rubber products | 419 | 184 | 160 | 16 | 5 | 1 | 2 | 235 | 214 | 11 | 10 | |
| Leather and leather products | 210 | 104 | 86 | 14 | 2 | 0 | 2 | 106 | 94 | 5 | 7 | |
| Stone, clay, and glass products | 668 | 357 | 259 | 45 | 31 | 9 | 12 | 311 | 271 | 28 | 12 | |
| Primary metal industries | 725 | 349 | 278 | 49 | 10 | 4 | 8 | 376 | 332 | 21 | 23 | |
| Fabricated metal products (except machinery and transportation equipment) | 1,385 | 657 | 536 | 91 | 13 | 8 | 8 | 728 | 632 | 46 | 50 | |
| Machinery (except electrical) | 1,015 | 435 | 359 | 57 | 10 | 4 | 5 | 580 | 509 | 28 | 43 | |
| , Electrical machinery, equipment, and supplies | 929 | 495 | 400 | 81 | 7 | 6 | 1 | 434 | 395 | 15 | 24 | |
| Aircraft and parts | 193 | 120 | 101 | 18 | 0 | 1 | 0 | 73 | 69 | 1 | 3 | |
| Ship and boat building and repairing | 106 | 62 | 50 | 7 | 4 | 1 | 0 | 44 | 34 | 3 | 7 | |
| Automotive and other transportation equipment | 504 | 298 | 226 | 57 | 8 | 6 | 1 | 206 | 175 | 13 | 18 | |
| Professional, scientific, and controlling instruments | 150 | 74 | 67 | 3 | 2 | 0 | 2 | 76 | 60 | 6 | 10 | |
| Miscellaneous manufacturing | 306 | 141 | 116 | 13 | 8 | 2 | 2 | 165 | 148 | 5 | 12 | |
| Agriculture, forestry, and fisheries | · | 10 | 10 | 0 | 0 | · | 0 | |||||
| 0 | · | 0 | 12 | 4 | ||||||||
| Mining | 375 | 252 | 181 | · | · | 2 | 2 | 5 | 123 | · | 8 | 5 |
| Metal mining | 55 | 28 | 22 | 5 | 0 | 0 | 1 | 0 | 27 | 24 | 0 | 3 |
| Construction | 2,476 | 2,164 | 788 | 529 | 476 | 164 | 3 | 104 | 312 | 264 | 47 | 1 |
| Wholesale trade | 1,901 | 791 | 549 | 161 | 53 | 10 | 3 | 15 | 1,110 | 917 | 102 | 91 |
| Retail trade | 3,156 | 1,529 | 1,173 | 211 | 65 | 3 | 11 | 66 | 1,627 | 1,344 | 188 | 95 |
| Finance, insurance, and real estate | 130 | 55 | 44 | 4 | 7 | 0 | 0 | 0 | 75 | 65 | 2 | 8 |
| Transportation, communication, and other public utilities | 2,909 | 1,860 | 1,153 | 441 | 190 | 26 | 12 | 38 | 1,049 | 904 | 68 | 77 |
| Services | 1,358 | 689 | 523 | 106 | 26 | 12 | 1 | 21 | 619 | 542 | 45 | 32 |
· marks a value that couldn’t be read from the scan — check the source image below.
Source images
Source data: U.S. NLRB Annual Reports (public domain). Reconstruction by NLRB Stats Archive. Verify figures against the source scan. Updated June 2026. · About