NLRB Stats Archive › Annual Reports › FY1996 › Representation elections held in cases closed
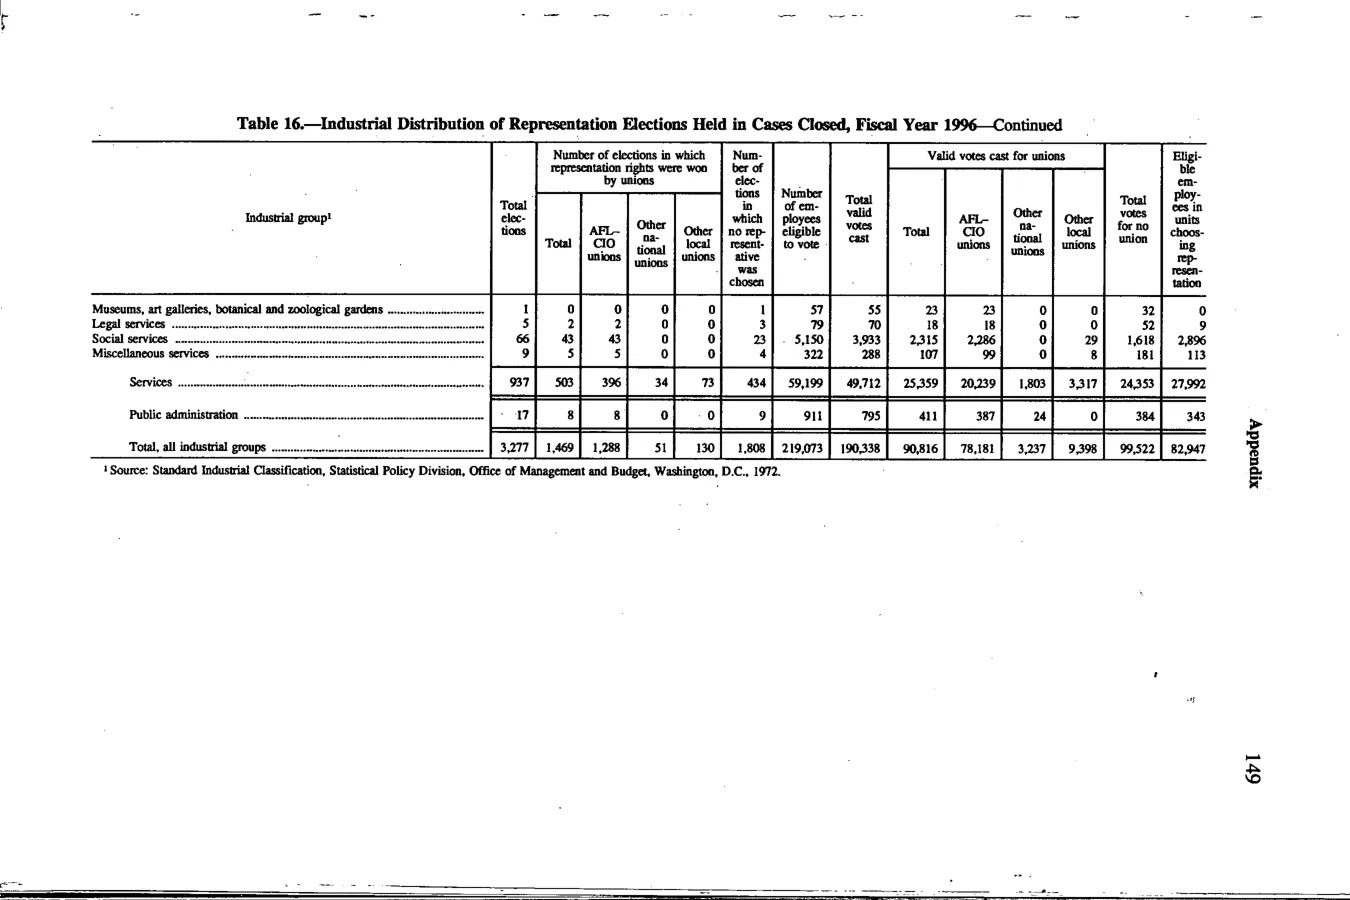
Representation elections held in cases closed
| Industrial group | Total elections | Number of elections in which representation rights were won by unions | Number of elections in which representation rights were won by unions | Number of elections in which representation rights were won by unions | Number of elections in which representation rights were won by unions | Number of elections in which no representative chosen | Number of employees eligible to vote | Total valid votes cast | Valid votes cast for unions | Valid votes cast for unions | Valid votes cast for unions | Valid votes cast for unions | Eligible employees in units choosing representation | |
|---|---|---|---|---|---|---|---|---|---|---|---|---|---|---|
| Industrial group | Total elections | Total | AFL-CIO unions | Other national unions | Other local unions | Number of elections in which no representative chosen | Number of employees eligible to vote | Total valid votes cast | Total | AFL-CIO unions | Other national unions | Other local unions | Votes for no representation | |
| Museums, art galleries, botanical and zoological gardens | 1 | 0 | 0 | 0 | 0 | 1 | 57 | 55 | 23 | 23 | 0 | 0 | 32 | 0 |
| Legal services | 5 | 2 | 2 | 0 | 0 | 3 | 39 | 36 | 18 | 18 | 0 | 0 | 18 | 0 |
| Social services | 26 | 6 | 4 | 2 | 0 | 20 | 5,150 | 3,933 | 2,315 | 2,286 | 0 | 29 | 1,618 | 2,896 |
| Miscellaneous | 9 | 5 | 5 | 0 | 0 | 4 | 232 | 232 | 107 | 99 | 0 | 8 | 181 | 113 |
| Services | 937 | 503 | 396 | 34 | 73 | 434 | 59,199 | 49,712 | 25,259 | 20,239 | 1,803 | 3,317 | 24,553 | 27,092 |
| Public administration | 17 | 8 | 8 | 0 | 0 | 9 | 919 | 811 | 411 | 387 | 24 | 0 | 400 | 508 |
| Total, all industrial groups | 3,277 | 1,469 | 1,288 | 51 | 130 | 1,808 | 219,073 | 190,338 | 90,816 | 78,181 | 3,237 | 9,398 | 99,522 | 82,947 |
Source image
Source data: U.S. NLRB Annual Reports (public domain). Reconstruction by NLRB Stats Archive. Updated June 2026.