NLRB Stats Archive › Annual Reports › FY1995 › Representation elections in cases closed
Representation elections in cases closed
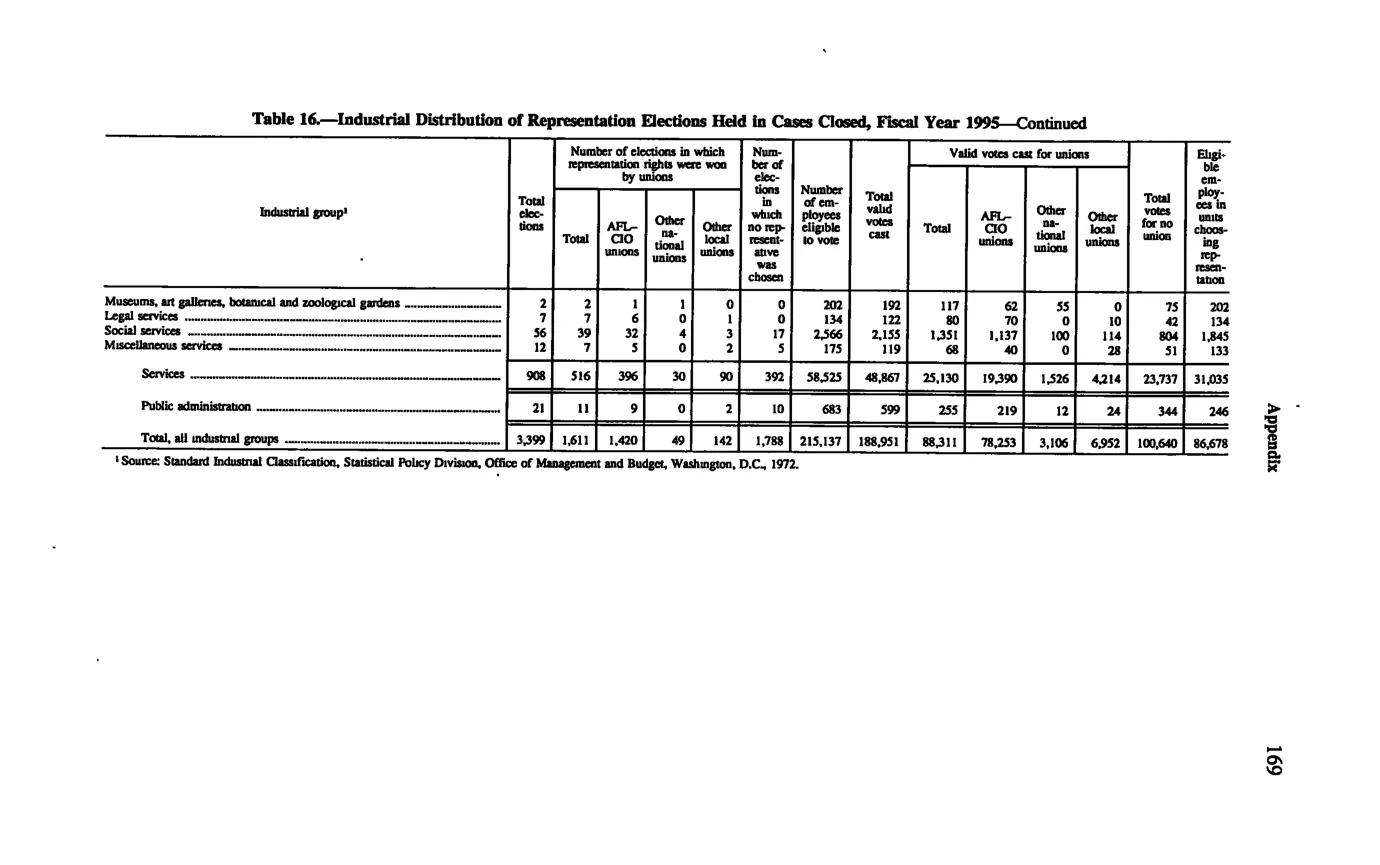
| Industrial group | Total elec- tions | Number of elections in which representation rights were won by unions | Number of elections in which representation rights were won by unions | Number of elections in which representation rights were won by unions | Number of elections in which representation rights were won by unions | Number of elec- tions in which no rep- resen- tative was chosen | Number of em- ployees eligible to vote | Total valid votes cast | Valid votes cast for unions | Valid votes cast for unions | Valid votes cast for unions | Valid votes cast for unions | Total votes for no union | Eligi- ble employ- ees in no rep- resenta- tion |
|---|---|---|---|---|---|---|---|---|---|---|---|---|---|---|
| Industrial group | Total elec- tions | Total | AFL- CIO unions | Other na- tional unions | Other local unions | Number of elec- tions in which no rep- resen- tative was chosen | Number of em- ployees eligible to vote | Total valid votes cast | Total | AFL- CIO unions | Other na- tional unions | Other local unions | Total votes for no union | Eligi- ble employ- ees in no rep- resenta- tion |
| Museums, art galleries, botanical and zoological gardens | 2 | 2 | 1 | 1 | 0 | 0 | 202 | 192 | 117 | 62 | 55 | 0 | 75 | 202 |
| Legal services | 7 | 6 | 0 | 6 | 0 | 1 | 134 | 122 | 80 | 70 | 10 | 0 | 42 | 53 |
| Social services | 56 | 39 | 32 | 1 | 0 | 17 | 2,566 | 2,155 | 1,351 | 1,137 | 100 | 114 | 804 | 1,345 |
| Miscellaneous services | 12 | 5 | 3 | 0 | 2 | 7 | 175 | 119 | 62 | 48 | 0 | 14 | 56 | 85 |
| Services (group total) | 908 | 516 | 396 | 30 | 90 | 392 | 58,525 | 48,867 | 25,130 | 19,390 | 1,526 | 4,214 | 23,737 | 31,033 |
| Public administration | 21 | 11 | 9 | 0 | 2 | 10 | 455 | 382 | 382 | 355 | 219 | 12 | 264 | 278 |
| Total, all industrial groups | 3,399 | 1,611 | 1,420 | 49 | 142 | 1,788 | 215,137 | 188,951 | 88,311 | 78,233 | 3,106 | 6,952 | 100,640 | 86,678 |
Source image
Source data: U.S. NLRB Annual Reports (public domain). Reconstruction by NLRB Stats Archive. Updated June 2026.