NLRB Stats Archive › Annual Reports › FY1995 › Disposition of objections in representation cases closed
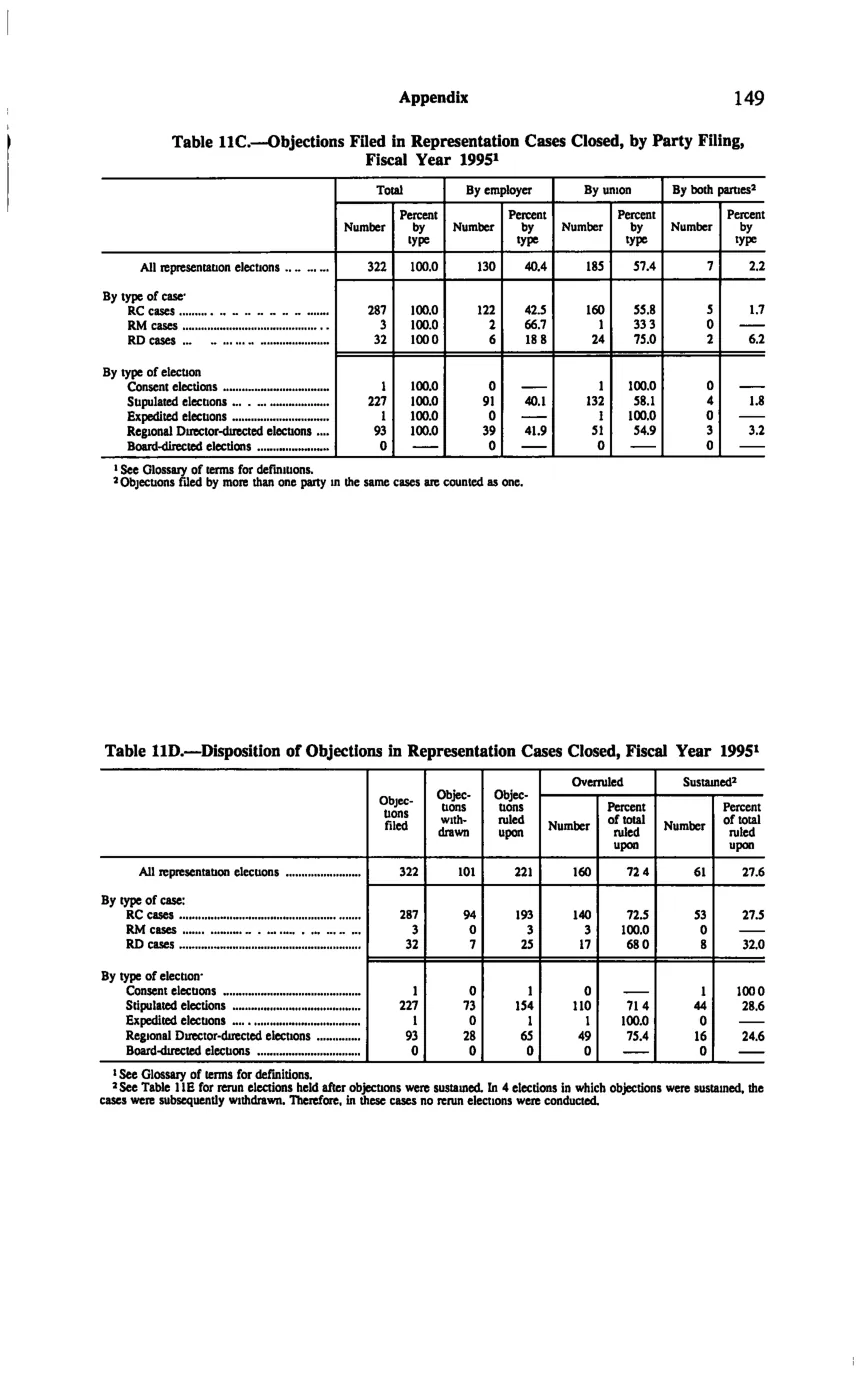
Disposition of objections in representation cases closed
| Objections filed | Objections withdrawn | Objections ruled upon | Overruled | Overruled | Sustained | Sustained | |
|---|---|---|---|---|---|---|---|
| Objections filed | Objections withdrawn | Objections ruled upon | Number | Percent of total ruled upon | Number | Percent of total ruled upon | |
| All representation elections | 322 | 101 | 221 | 160 | 72.4 | 61 | 27.6 |
| By type of case: | |||||||
| RC cases | 287 | 94 | 193 | 140 | 72.5 | 53 | 27.5 |
| RM cases | 3 | 0 | 3 | 3 | 100 | 0 | |
| RD cases | 32 | 7 | 25 | 17 | 68 | 8 | 32 |
| By type of election: | |||||||
| Consent elections | 1 | 0 | 1 | 0 | 1 | 100 | |
| Stipulated elections | 227 | 73 | 154 | 110 | 71.4 | 44 | 28.6 |
| Expedited elections | 1 | 0 | 1 | 1 | 100 | 0 | |
| Regional Director-directed elections | 93 | 28 | 65 | 49 | 75.4 | 16 | 24.6 |
| Board-directed elections | 0 | 0 | 0 | 0 | 0 |
Source image
Source data: U.S. NLRB Annual Reports (public domain). Reconstruction by NLRB Stats Archive. Updated June 2026.