NLRB Stats Archive › Annual Reports › FY1993 › Representation elections held in cases closed, by industry
Representation elections held in cases closed, by industry
| Legal services | 7 | 5 | 4 | 0 | 1 | 2 | 217 | 205 | 162 | 115 | o | 47 | 43 | 176 |
|---|---|---|---|---|---|---|---|---|---|---|---|---|---|---|
| Social services | 76 | 47 | 45 | 0 | 2 | 29 | 3,061 | 2,514 | 1,622 | 1,580 | 8 | 34 | 892 | 1,982 |
| Miscellaneous services . | 17 | 8 | 7 | 1 | 0 | 9 | 528 | 487 | 152 | 145 | 7 | o | 335 | 65 |
| Services | 944 | 527 | 432 | 32 | 63 | 417 | 61,421 | 51,058 | 28,283 | 23,313 | 1,410 | 3,560 | 22,775 | 32,870 |
| Public administration | 17 | 4 | 4 | o | o | 13 | 980 | 875 | 423 | 414 | 9 | o | 452 | 184 |
| Total, all industrial groups | 3,586 | 1,706 | 1,533 | 64 | 109 | 1,880 | 231,187 | 201,557 | 99,918 | 87,805 | 3,239 | 8,874 | 101,639 | 97,166 |
Source image
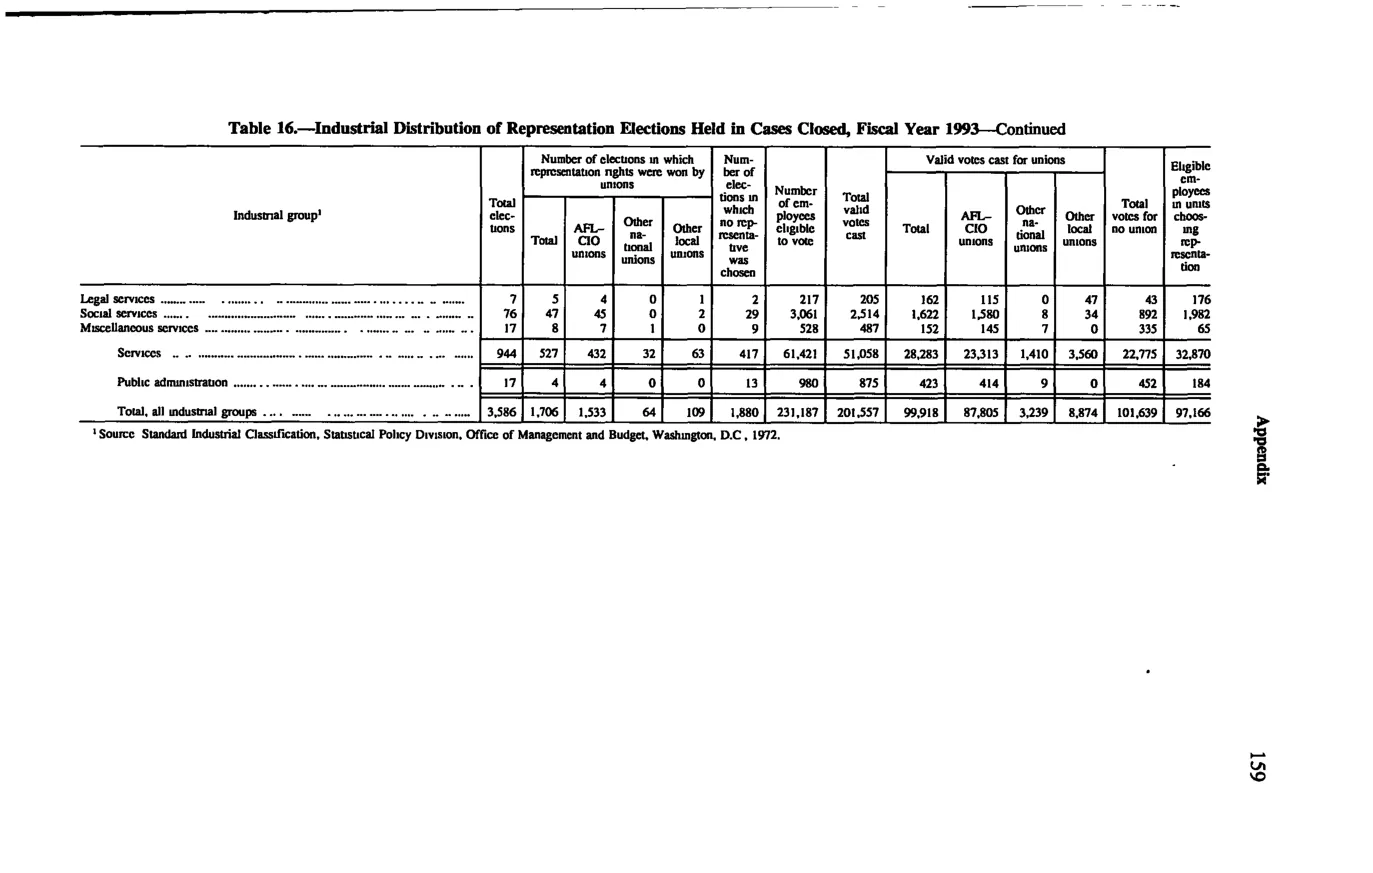
Source data: U.S. NLRB Annual Reports (public domain). Reconstruction by NLRB Stats Archive. Updated June 2026.