NLRB Stats Archive › Annual Reports › FY1993 › Representation elections held in cases closed
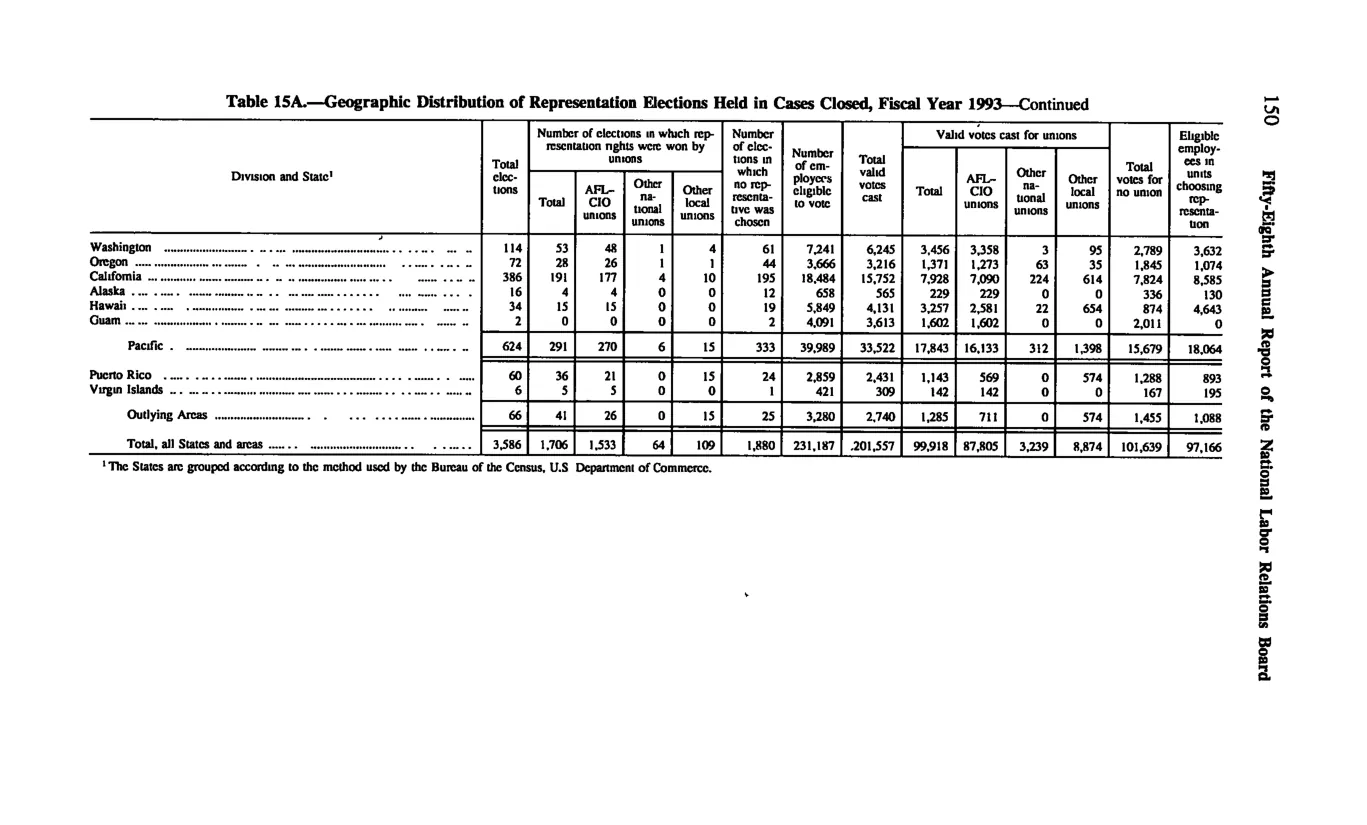
Representation elections held in cases closed
| Division and State | Total elections | Number of elections in which representation rights were won by unions — Total | Number of elections in which representation rights were won by unions — AFL-CIO unions | Number of elections in which representation rights were won by unions — Other national unions | Number of elections in which representation rights were won by unions — Other local unions | Number of elections in which no representation chosen | Number of employees eligible to vote | Total valid votes cast | Valid votes for unions — Total | Valid votes for unions — AFL-CIO unions | Valid votes for unions — Other national unions | Valid votes for unions — Other local unions | Total votes for no union | Total employees in units choosing representation |
|---|---|---|---|---|---|---|---|---|---|---|---|---|---|---|
| Washington | 114 | 53 | 48 | 1 | 4 | 61 | 7,241 | 6,245 | 3,456 | 3,358 | 3 | 95 | 2,789 | 3,632 |
| California | 386 | 191 | 177 | 4 | 10 | 195 | 18,436 | 15,732 | 7,928 | 7,290 | 254 | 384 | 7,804 | 8,236 |
| Pacific Division — subtotal | 624 | 291 | 270 | 6 | 15 | 333 | 39,815 | 33,512 | 17,843 | 16,133 | 312 | 1,398 | 15,679 | 18,031 |
| Outlying Areas — subtotal (Puerto Rico + Virgin Islands) | 65 | 37 | 22 | 0 | 15 | 28 | 3,249 | 2,740 | 1,285 | 711 | 0 | 574 | 1,455 | 1,088 |
| Total, all States and areas | 3,586 | 1,706 | 1,533 | 64 | 109 | 1,880 | 231,187 | 201,557 | 99,918 | 87,805 | 3,289 | 8,874 | 101,659 | 97,196 |
Source image
Source data: U.S. NLRB Annual Reports (public domain). Reconstruction by NLRB Stats Archive. Updated June 2026.