NLRB Stats Archive › Annual Reports › FY1993 › Disposition of objections in representation election cases closed
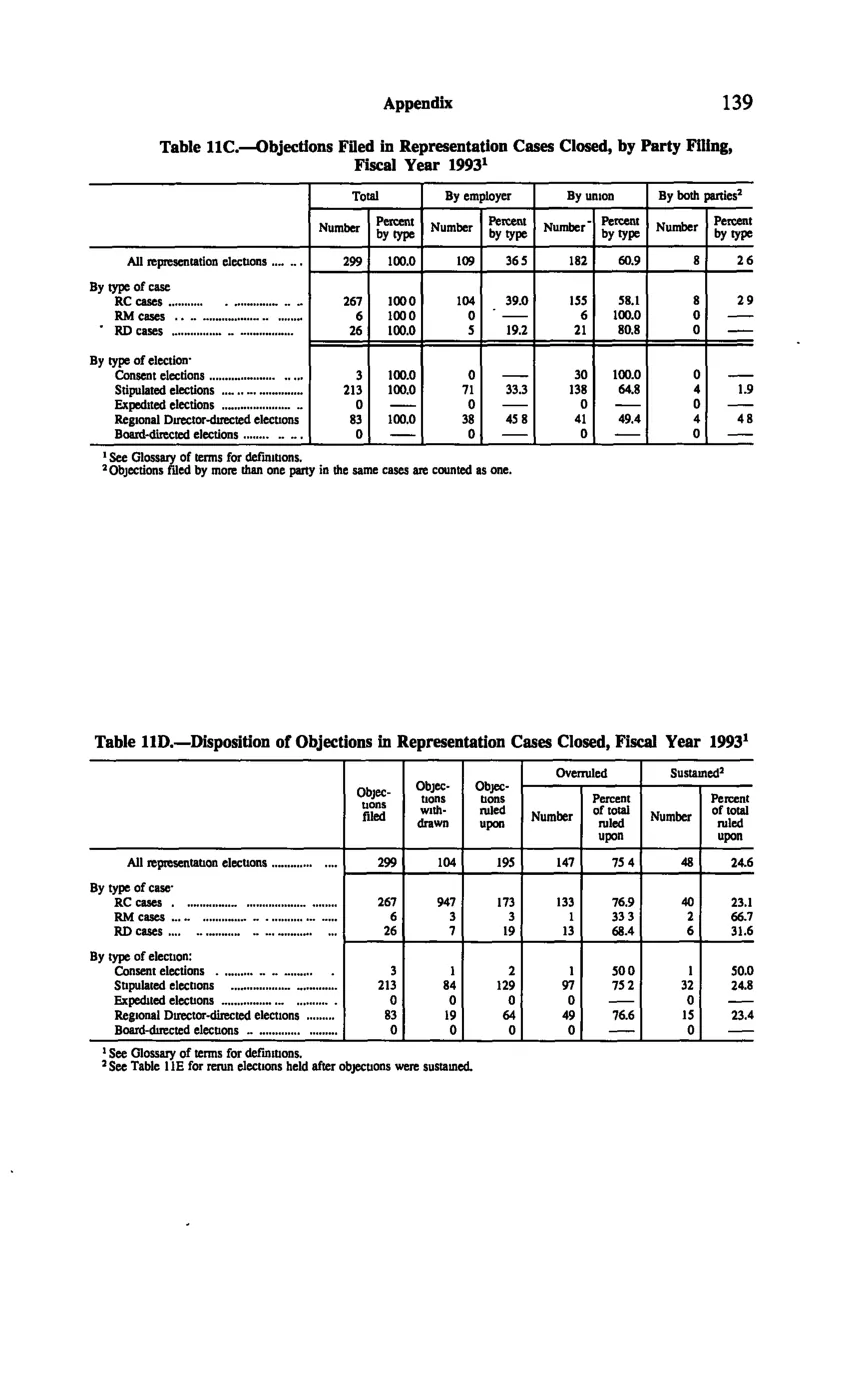
Disposition of objections in representation election cases closed
| Identification | Objections filed | Objections withdrawn | Objections ruled upon | Overruled — Number | Overruled — Percent of total ruled upon | Sustained — Number | Sustained — Percent of total ruled upon |
|---|---|---|---|---|---|---|---|
| All representation elections | 299 | 104 | 195 | 147 | 75.4 | 48 | 24.6 |
| By type of case — RC cases | 267 | 94 | 173 | 133 | 76.9 | 40 | 23.1 |
| By type of case — RM cases | 6 | 3 | 3 | 1 | 33.3 | 2 | 66.7 |
| By type of case — RD cases | 26 | 7 | 19 | 13 | 68.4 | 6 | 31.6 |
| By type of election — Consent elections | 3 | 1 | 2 | 1 | 50 | 1 | 50 |
| By type of election — Stipulated elections | 213 | 84 | 129 | 97 | 75.2 | 32 | 24.8 |
| By type of election — Expedited elections | 0 | 0 | 0 | 0 | 0 | ||
| By type of election — Regional Director-directed elections | 83 | 19 | 64 | 49 | 76.6 | 15 | 23.4 |
| By type of election — Board-directed elections | 0 | 0 | 0 | 0 | 0 |
Source image
Source data: U.S. NLRB Annual Reports (public domain). Reconstruction by NLRB Stats Archive. Updated June 2026.