NLRB Stats Archive › Annual Reports › FY1991 › Representation elections held in cases closed
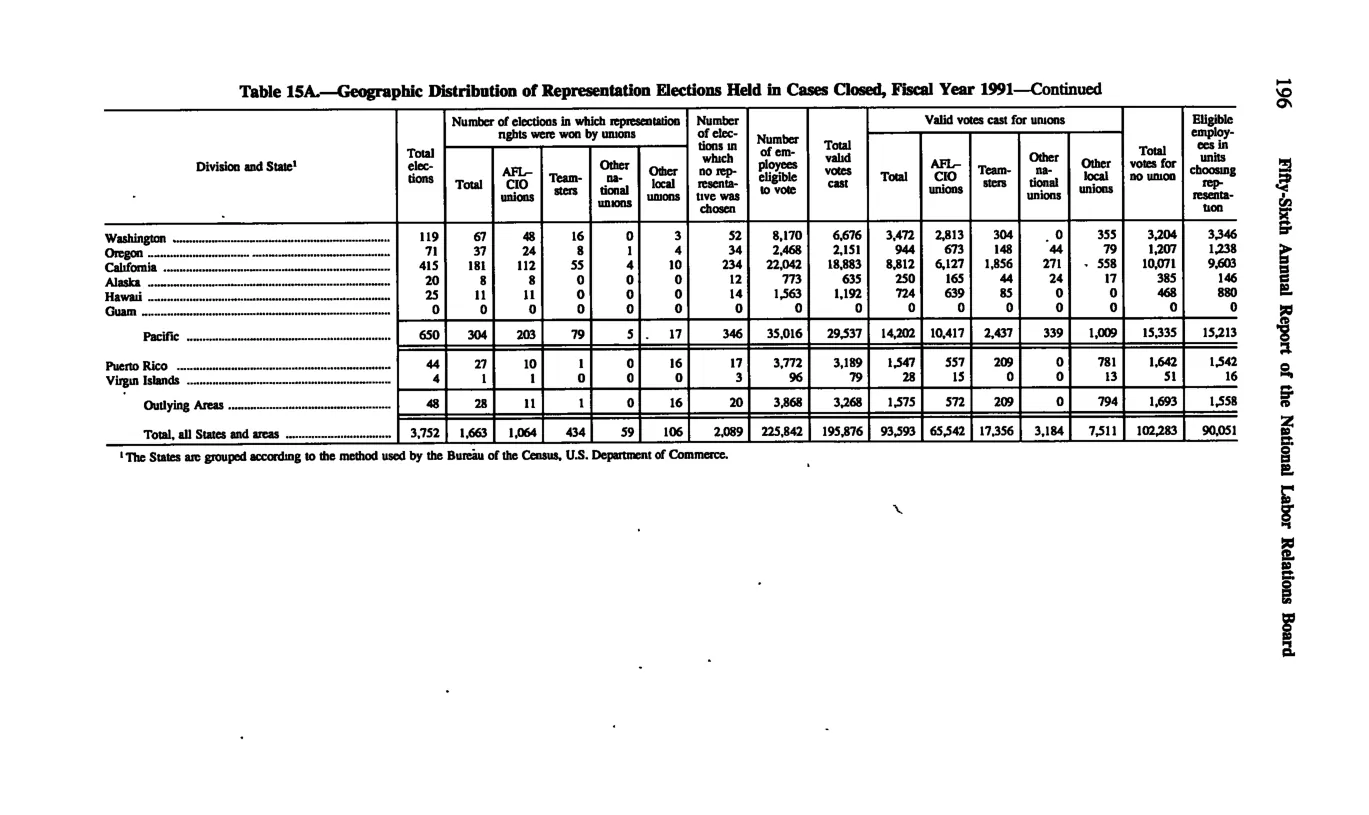
Representation elections held in cases closed
| Division and State | Total elections | Number of elections in which representation rights were won by unions — Total | AFL-CIO unions won | Teamsters won | Other national unions won | Other local unions won | Number of elections in which no representative chosen | Number of employees eligible to vote | Total valid votes cast | Valid votes cast for unions — Total | AFL-CIO unions | Teamsters | Other national unions | Other local unions | Total valid votes cast for no representation | Eligible employees in elections choosing no representation |
|---|---|---|---|---|---|---|---|---|---|---|---|---|---|---|---|---|
| Washington | 119 | 67 | 48 | 16 | 0 | 3 | 70 | 6,879 | 6,676 | 3,472 | 2,813 | 304 | 0 | 355 | 3,204 | 3,544 |
| California | 415 | 181 | 112 | 53 | 4 | 12 | 234 | 22,042 | 18,883 | 8,672 | 5,851 | 1,856 | 271 | 558 | 10,223 | 9,653 |
| Pacific — Division subtotal | 650 | 304 | 203 | 79 | 5 | 17 | 346 | 35,016 | 29,537 | 14,202 | 10,417 | 2,437 | 339 | 1,011 | 15,613 | 15,213 |
| Outlying Areas — subtotal | 48 | 31 | 14 | 10 | 0 | 7 | 17 | 1,720 | 1,659 | 1,375 | 372 | 1,184 | 0 | 0 | 0 | 1,562 |
| Total, all States and areas — GRAND TOTAL FY1991 | 3,752 | 1,664 | 1,054 | 434 | 39 | 106 | 2,089 | 225,842 | 195,876 | 53,591 | 36,963 | 8,758 | 2,257 | 5,329 | 102,283 | 90,051 |
Source image
Source data: U.S. NLRB Annual Reports (public domain). Reconstruction by NLRB Stats Archive. Updated June 2026.