NLRB Stats Archive › Annual Reports › FY1989 › Representation elections held in cases closed
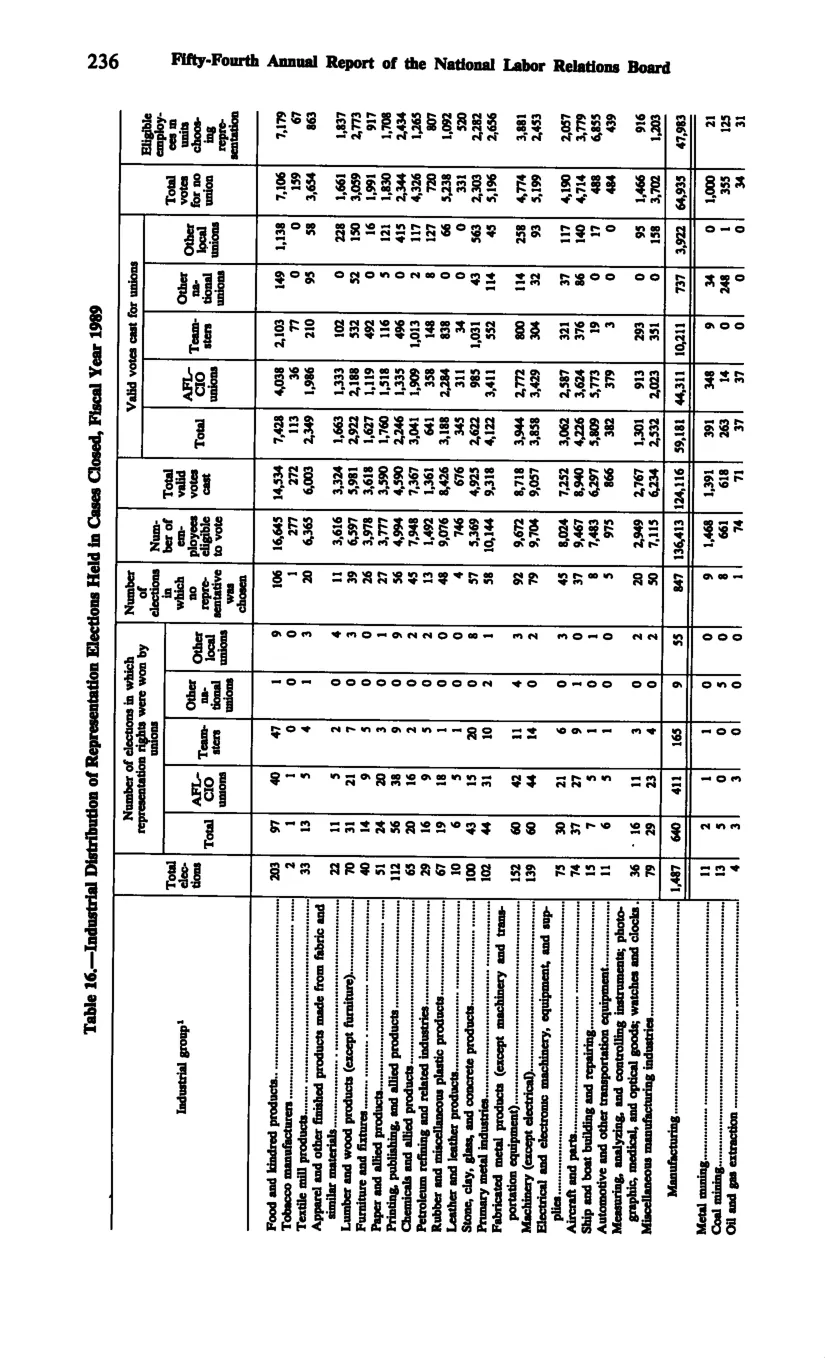
Representation elections held in cases closed
| Industrial group | Total elections | Number of elections in which representation rights were won by unions — Total | Number of elections in which representation rights were won by unions — AFL-CIO unions | Number of elections in which representation rights were won by unions — Teamsters | Number of elections in which representation rights were won by unions — Other national unions | Number of elections in which representation rights were won by unions — Other local unions | Number of elections in which no representative was chosen | Total valid votes cast | Votes for unions — Total | Votes for unions — AFL-CIO unions | Votes for unions — Teamsters | Votes for unions — Other national unions | Votes for unions — Other local unions | Votes for no union | Eligible employees in units of unions chosen as representative |
|---|---|---|---|---|---|---|---|---|---|---|---|---|---|---|---|
| Food and kindred products | 203 | 97 | 80 | 17 | 0 | 0 | 106 | 14,254 | 7,628 | 4,608 | 2,103 | 13 | 149 | 7,108 | 7,879 |
| Manufacturing (sector total) | 1,407 | 643 | 411 | 165 | 11 | 5 |
Source image
Source data: U.S. NLRB Annual Reports (public domain). Reconstruction by NLRB Stats Archive. Updated June 2026.