NLRB Stats Archive › Annual Reports › FY1989 › Final outcomes of representation elections — RM cases
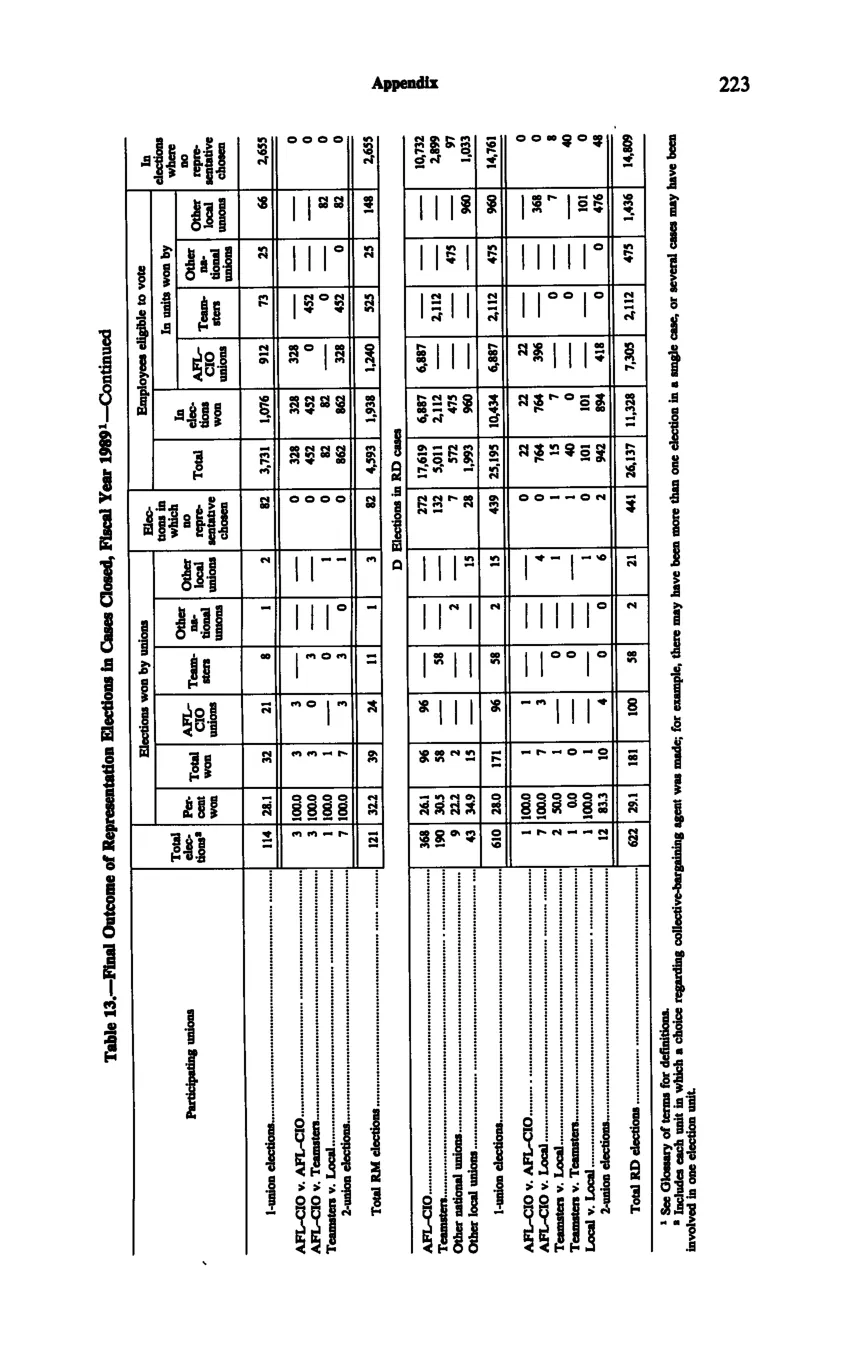
Final outcomes of representation elections — RM cases
| Participating unions | Total elections | Percent won | Elections won by unions — Total won | Elections won by unions — AFL-CIO unions | Elections won by unions — Teamsters | Elections won by unions — Other national unions | Elections won by unions — Other local unions | Elections in which no representative chosen | Employees eligible to vote — Total | Employees eligible — In units won by AFL-CIO unions | Employees eligible — In units won by Teamsters | Employees eligible — In units won by Other national unions | Employees eligible — In units won by Other local unions | In elections — no representative chosen (count) |
|---|---|---|---|---|---|---|---|---|---|---|---|---|---|---|
| 1-union elections (RM, sub-total) | 114 | 28.1 | 32 | 21 | 8 | 1 | 2 | 82 | 3,731 | 1,076 | 912 | 73 | 25 | 2,655 |
| 2-union elections (RM, sub-total) | 7 | 100 | 7 | 3 | 3 | 1 | 0 | 862 | 328 | 452 | 82 | 0 | ||
| Total RM elections | 121 | 32.2 | 39 | 24 | 11 | 2 | 2 | 82 | 4,593 | 1,938 | 1,240 | 525 | 148 | 2,655 |
Source image
Source data: U.S. NLRB Annual Reports (public domain). Reconstruction by NLRB Stats Archive. Updated June 2026.