NLRB Stats Archive › Annual Reports › FY1988 › Disposition of objections in representation cases closed
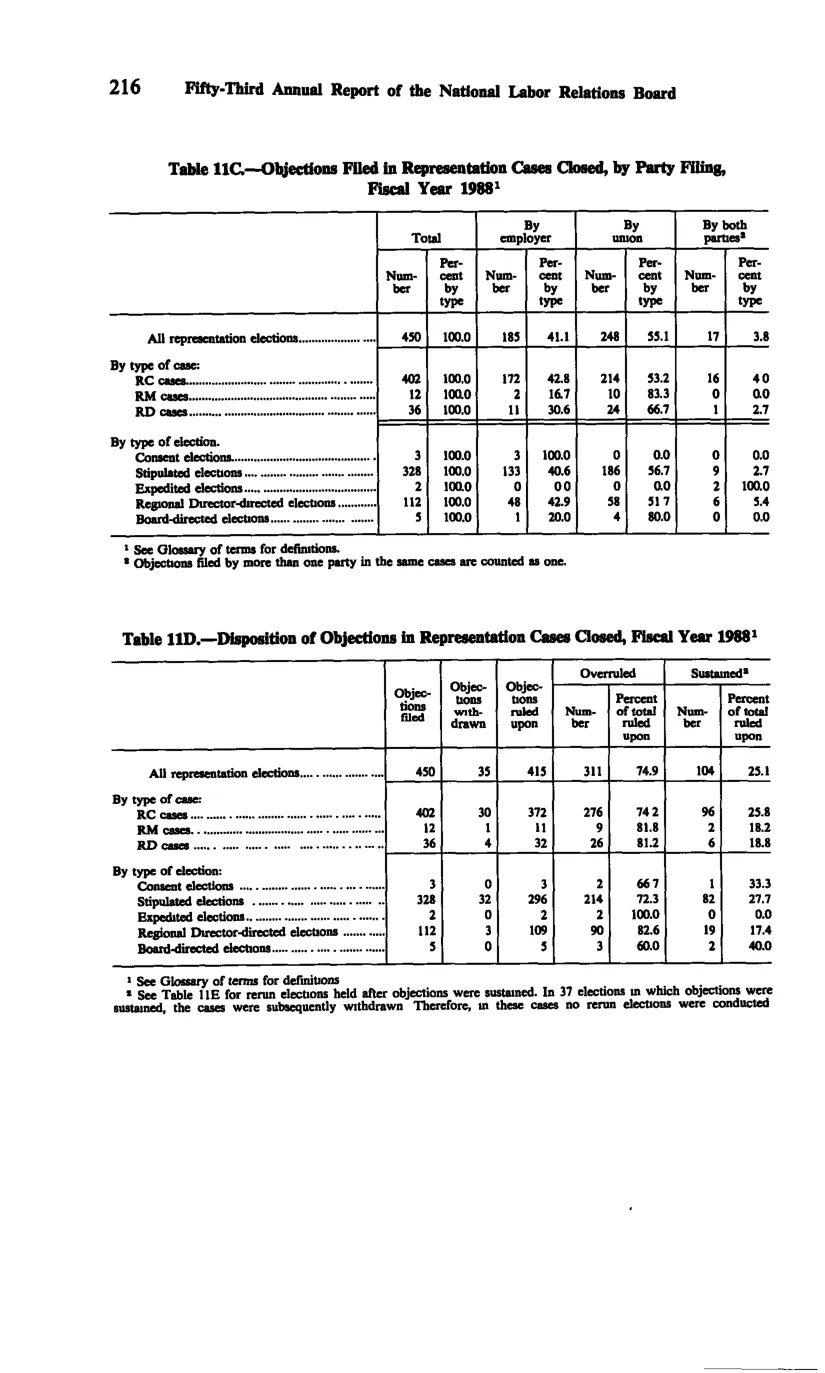
Disposition of objections in representation cases closed
| Type of case / type of election | Objections filed | Objections withdrawn | Objections ruled upon | Overruled — Number | Overruled — Percent of total ruled upon | Sustained — Number | Sustained — Percent of total ruled upon |
|---|---|---|---|---|---|---|---|
| All representation elections | 450 | 35 | 415 | 311 | 74.9 | 104 | 25.1 |
| RC cases | 402 | 30 | 372 | 276 | 74.2 | 96 | 25.8 |
| RM cases | 12 | 1 | 11 | 9 | 81.8 | 2 | 18.2 |
| RD cases | 36 | 4 | 32 | 26 | 81.2 | 6 | 18.8 |
| Consent elections | 3 | 0 | 3 | 2 | 66.7 | 1 | 33.3 |
| Stipulated elections | 328 | 32 | 296 | 214 | 72.3 | 82 | 27.7 |
| Expedited elections | 2 | 0 | 2 | 2 | 100 | 0 | 0 |
| Regional Director-directed elections | 112 | 3 | 109 | 90 | 82.6 | 19 | 17.4 |
| Board-directed elections | 5 | 0 | 5 | 3 | 60 | 2 | 40 |
Source image
Source data: U.S. NLRB Annual Reports (public domain). Reconstruction by NLRB Stats Archive. Updated June 2026.