NLRB Stats Archive › Annual Reports › FY1986 › Representation elections held in cases closed
Representation elections held in cases closed
| Division and State | Total elections | Number of elections in which representation rights were won by unions — Total | AFL-CIO unions | Teamsters | Other national unions | Other local unions | Number of elections in which no representative was chosen | Number of employees eligible to vote | Total valid votes cast | Valid votes cast for unions — Total | Valid votes cast for unions — AFL-CIO unions | Valid votes cast for unions — Teamsters | Valid votes cast for unions — Other national unions | Valid votes cast for unions — Other local unions | Total valid votes cast for no representation | Eligible employees in elections choosing no representation | |
|---|---|---|---|---|---|---|---|---|---|---|---|---|---|---|---|---|---|
| Nevada | 21 | 7 | 1 | 2 | 0 | 4 | 14 | 887 | 690 | 330 | 28 | 0 | 133 | 0 | 169 | 360 | 482 |
| Mountain — Division subtotal | 186 | 81 | 55 | 14 | 0 | 10 | 105 | 8,741 | 7,365 | 3,381 | 2,254 | 497 | 141 | 489 | 4,384 | 3,238 | |
| Washington | 147 | 56 | 25 | 24 | 0 | 7 | 91 | 4,593 | 3,466 | 1,625 | 897 | 616 | 2 | 110 | 1,841 | 1,699 | |
| California | 548 | 229 | 125 | 85 | 5 | 14 | 319 | 22,923 | 19,583 | 9,919 | 6,428 | 2,520 | 374 | 597 | 9,664 | 10,232 | |
| Pacific — Division subtotal | 832 | 338 | 178 | 123 | 10 | 27 | 494 | 39,558 | 30,088 | 13,165 | 9,407 | 3,997 | 592 | 876 | 15,536 | 13,667 | |
| Outlying Areas — subtotal (Puerto Rico + Virgin Islands) | 53 | 30 | 2 | 8 | 0 | 20 | 23 | 4,349 | 3,994 | 1,729 | 476 | 345 | 0 | 877 | 2,232 | 1,632 | |
| Total, all States and areas (GRAND TOTAL) | 4,520 | 1,951 | 1,204 | 524 | 61 | 162 | 2,569 | 259,278 | 229,573 | 106,461 | 76,291 | 17,373 | 3,977 | 8,814 | 123,112 | 91,999 |
Source image
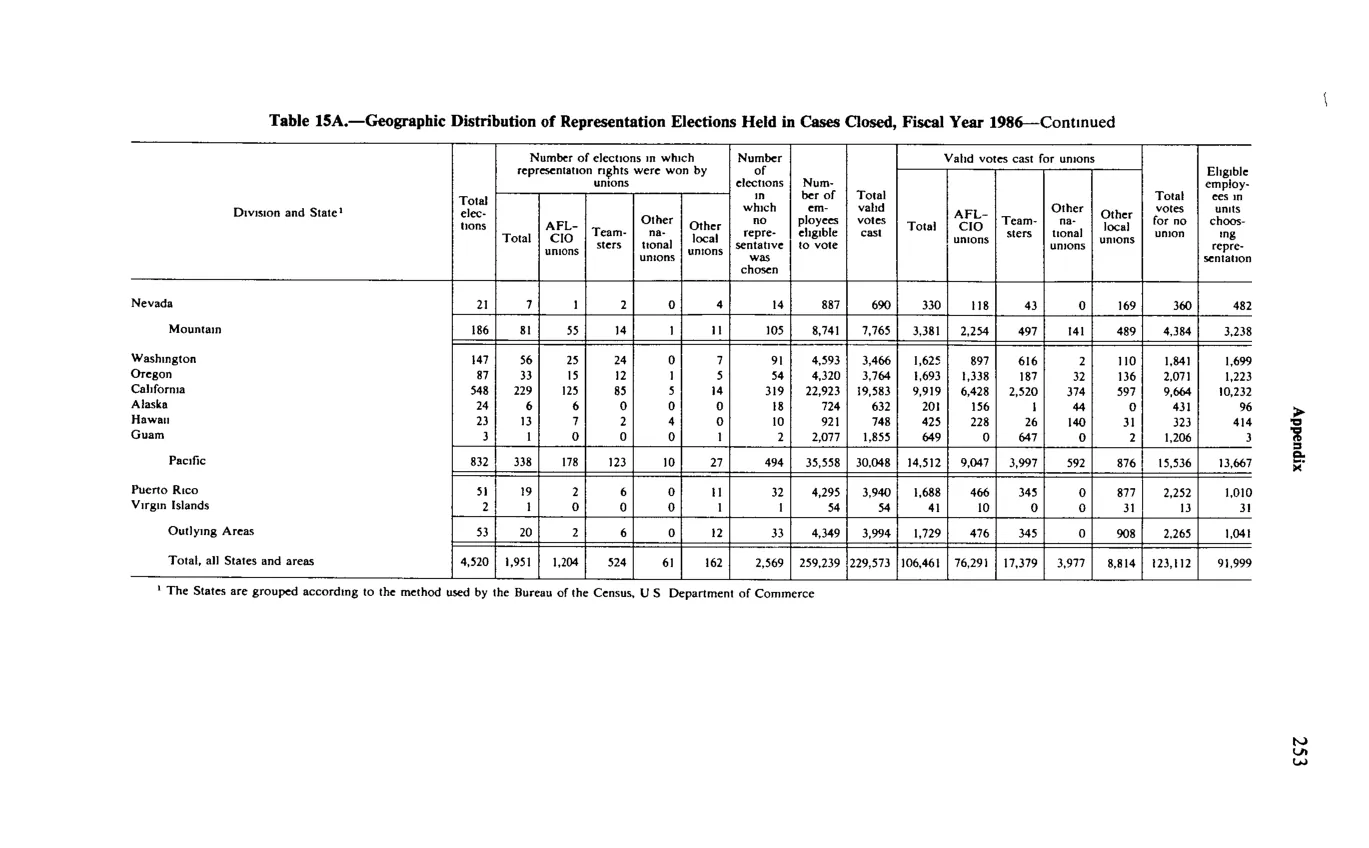
Source data: U.S. NLRB Annual Reports (public domain). Reconstruction by NLRB Stats Archive. Updated June 2026.